First
Last
email@email.com
Arakawa Quant (Getting Started Guide)
Breaking Quantitative Model
March 4, 2026


AQ Team
Quantifying Global Macro Friction & Institutional Capital Flows
Arakawa Quant is a trading signal and research platform built on quantitative models and market structure analysis, covering multiple markets including crypto assets and U.S. equities. The system applies multi-model quantitative research and statistical testing to identify high-probability trading opportunities in the market, which are then structured into standardized signals and analytical outputs to support more consistent and systematic decision-making.
Unlike trading approaches driven by subjective judgment, the system emphasizes rule-based consistency and data-driven logic. It transforms market behavior into a structured framework of actionable signals and analysis, while not constituting any form of profit guarantee or investment advice.
Product Architecture
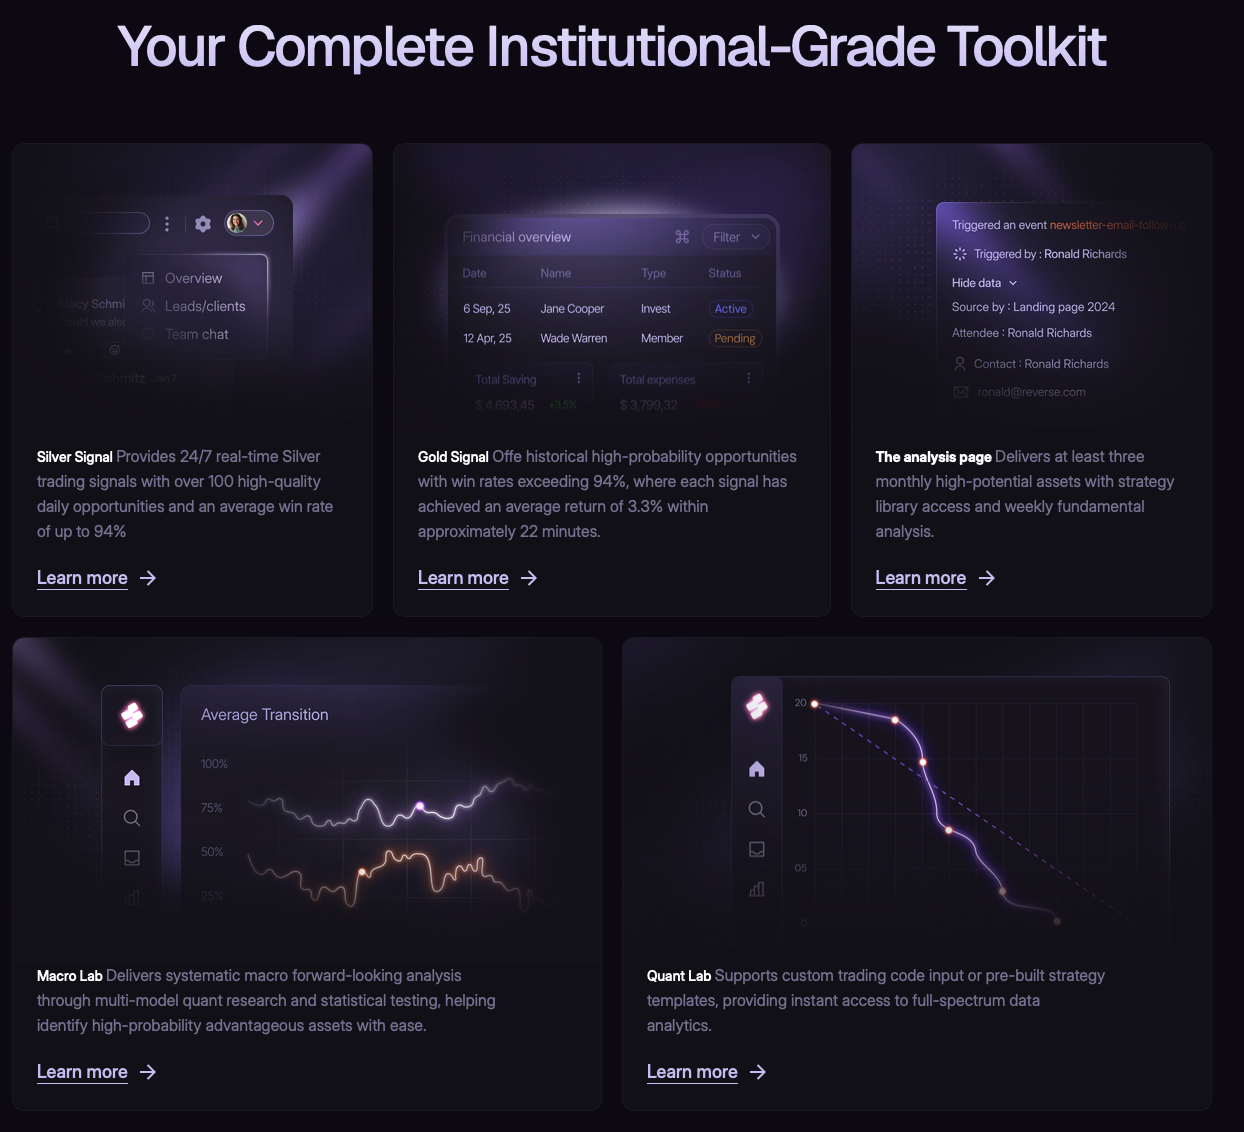
Arakawa Quant consists of four core modules: Quant Signals (Gold & Silver), Analysis, Macro Lab, and Quant Lab.
Quant Signals is responsible for generating actionable trading opportunities. The Analysis module provides a higher-level market information layer, including Arakawa Quant Picks and Articles (Market News, selected asset analyses, and parts of Strategy content), helping users understand overall market conditions from both macro dynamics and asset selection logic perspectives. Macro Lab delivers systematic macro forward-looking analysis, while Quant Lab focuses on strategy research and code-level quantitative data analysis.
Quant Signals (Quantitative Signal System)
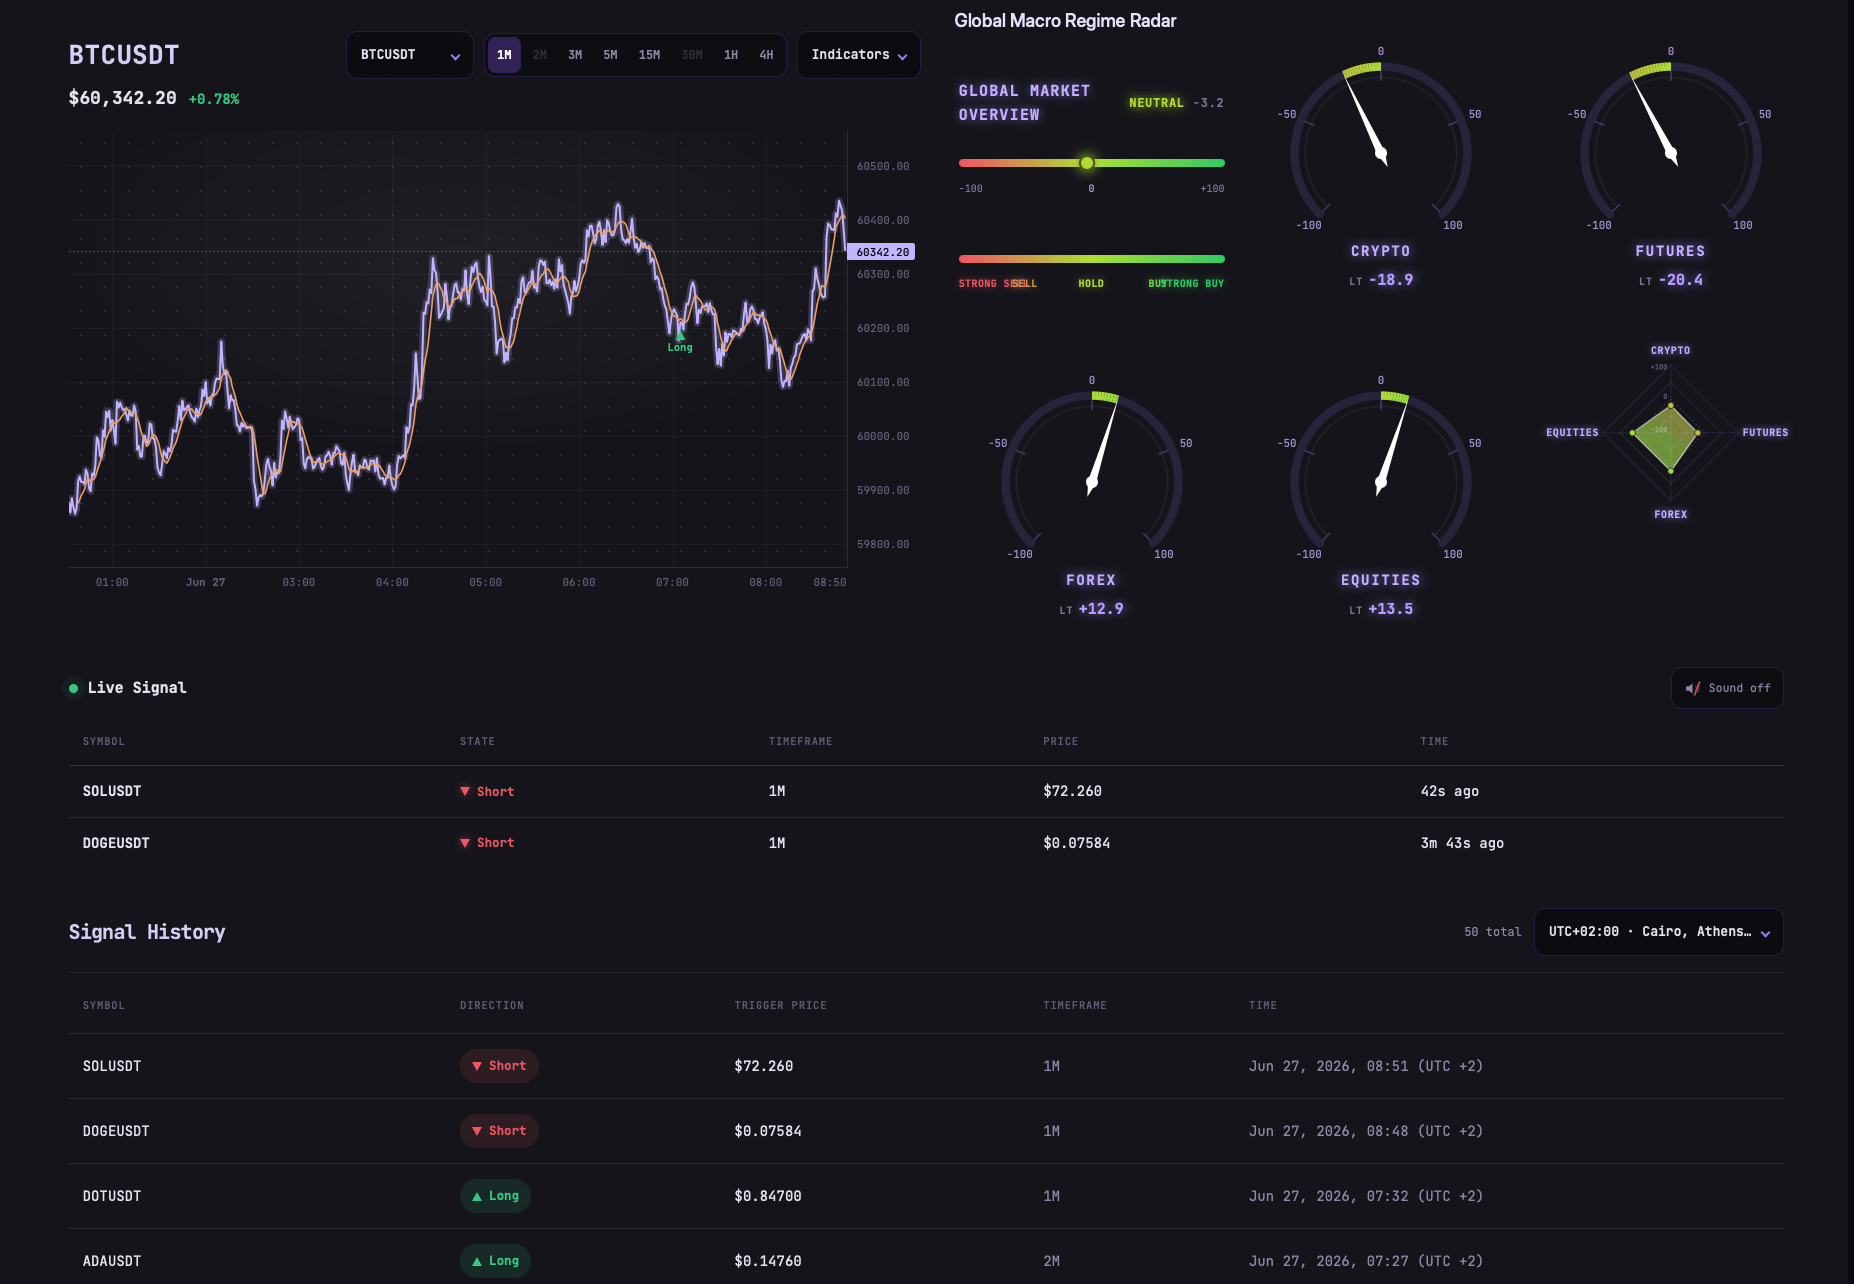
Quant Signals is the core execution module of Arakawa Quant. It maps trading opportunities identified by quantitative models directly onto real-time market charts, combined with macro risk evaluation and historical signal tracking, forming a complete trading observation and execution interface.
This module does not simply display isolated signals. Instead, it integrates price behavior, strategy triggers, macro environment context, and historical statistics into a unified interface, allowing users to understand both market structure and signal logic within the same view.
Gold and Silver Signals
All trading signals within Quant Signals are categorized into two tiers based on model confidence: Gold Signals and Silver Signals.
Gold Signals represent premium, high-conviction opportunities derived from multi-model consensus. Based on historical performance, they achieve a win rate above 94% and typically indicate clearer market direction and stronger structural confirmation, making them the highest-priority signals in the system.
Silver Signals are also generated by quantitative models and maintain an average historical win rate of around 94%. However, they may exhibit slightly lower structural certainty or market stability compared to Gold Signals and are more often used to capture mid- to short-term opportunities or structural continuation setups.
Each signal typically includes direction (Long / Short), asset, entry range, stop-loss level, and take-profit targets, along with a brief structural explanation describing the reasoning behind the signal.
In practice, users are expected to first identify the signal tier, then combine it with market structure information to determine execution priority, followed by appropriate position sizing and risk control.
Main Chart & Controls
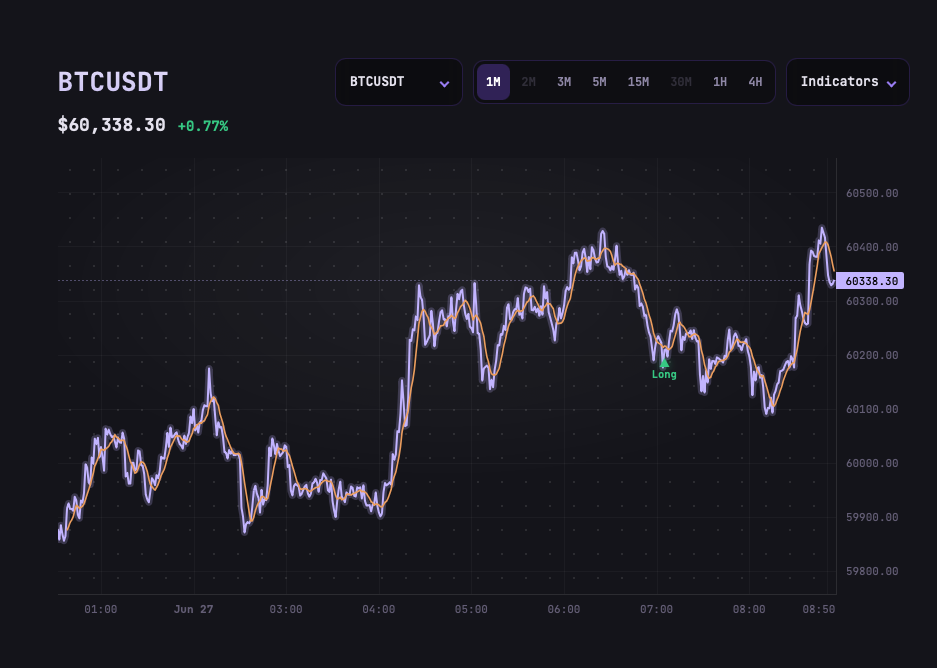
The central area of the interface displays the real-time price chart of a selected asset, such as BTCUSDT, along with live price changes and percentage performance for basic market reference.
The chart supports multiple controls, including trading pair selection, timeframe switching (ranging from lower-minute structures to hourly perspectives), and the application of various technical indicators to accommodate different trading horizons.
Beyond price action, strategy-triggered events are directly plotted on the candlestick chart. Long (green) and Short (red) signals are visually marked on price structure, allowing users to clearly see where the model identifies trading opportunities. This design ensures that signal generation and price structure analysis are aligned within the same visual framework rather than being separated.
Global Macro Regime Radar
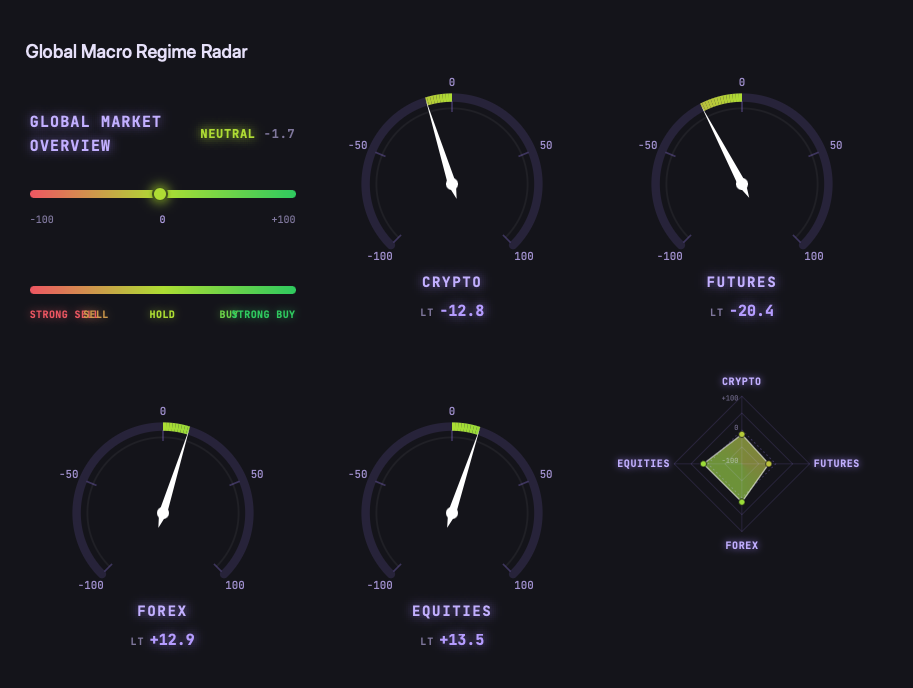
The right-side module provides a quantified macro-level assessment of the overall market environment, serving as a structured reference for risk conditions and market sentiment.
The system first presents a qualitative regime classification, such as Mild Bear or other market phases, to define the overall risk backdrop. In addition, a quantitative sentiment slider ranging from -100 to +100 visualizes the distribution of market bias, allowing users to interpret whether conditions are bearish, neutral, or bullish.
The module also includes macro indicators related to FX and liquidity conditions, presented through gauge-style visualizations. These indicators do not correspond to individual assets but instead reflect broader capital environment pressure and momentum conditions across markets.
Live Signal & History
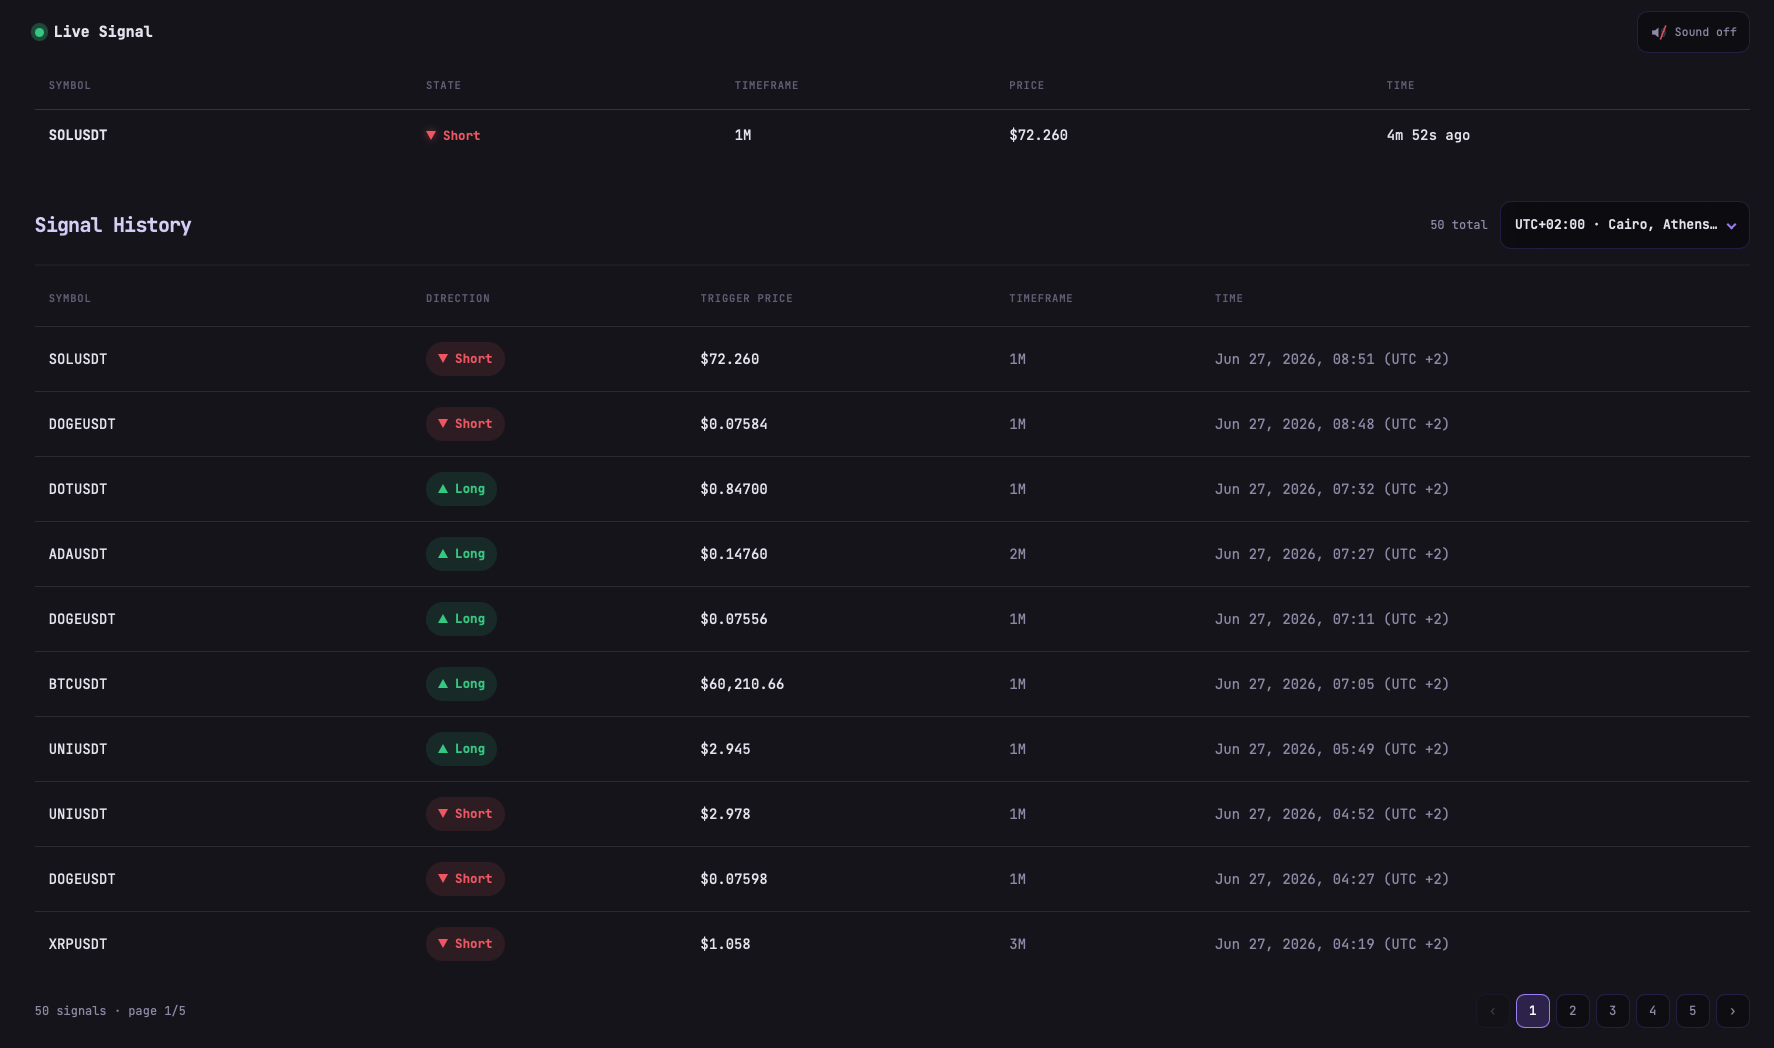
The Live Signal section displays real-time signal flow and historical statistics, serving as the bridge between real-time execution and long-term validation.
Live signals are continuously updated in a time-stream format, showing newly triggered opportunities along with asset, timeframe, trigger price, direction (Long or Short), and timestamp, allowing users to evaluate signal freshness and immediacy. This section also includes sound notifications for real-time alerts when new signals appear.
The Signal History section provides a complete record of all past signals, enabling full retrospective analysis and performance review. Users can browse historical signals chronologically and adjust time zones to align with their local trading time, facilitating more accurate behavioral analysis and strategy evaluation.
Analysis: Research and Strategy Evaluation Module
The Analysis module serves as the strategy research and validation layer of Arakawa Quant. It provides a higher-level market information system composed of Arakawa Quant Picks and Articles, enabling users to understand both historical performance and the contextual logic behind model outputs.
Arakawa Quant Picks
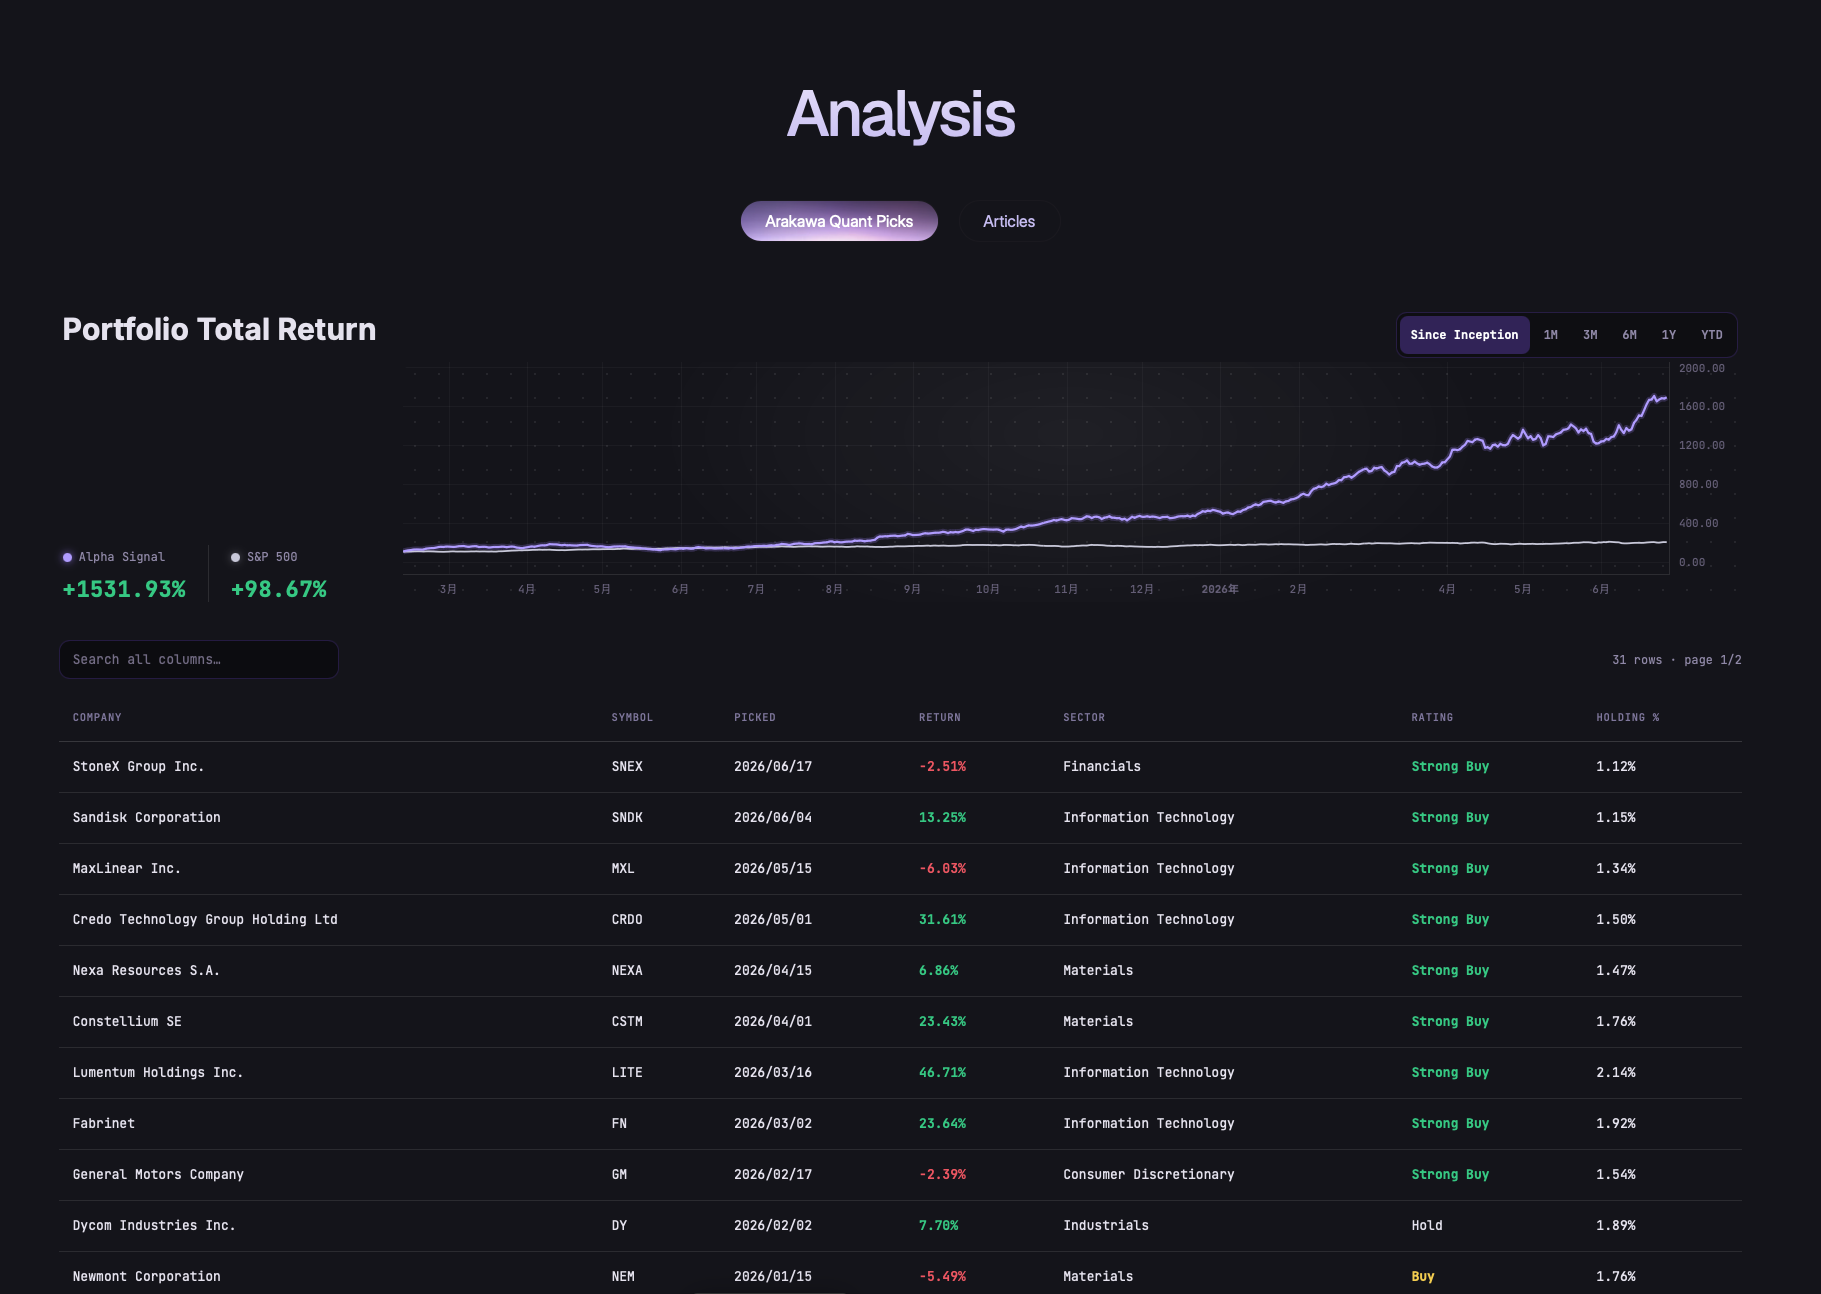
Arakawa Quant Picks represents the performance layer of the Analysis module, showcasing selected assets and portfolio returns generated by the quantitative system. It constructs a full traceable structure from overall portfolio performance down to individual asset contributions.
At the portfolio level, the system presents the Alpha Signal total return curve and compares it against benchmarks such as the S&P 500. Historically, Alpha Signal has achieved significant excess returns (+1531.93% vs +98.67%), with a steadily upward trajectory and an acceleration in later phases, reflecting strong performance in trending market environments.
Below the portfolio view is the Quant Picks table, which breaks down the sources of returns. It records assets selected at different points in time, including company name, ticker, entry date, sector classification, return performance, and current position weight. All assets are uniformly rated as Strong Buy, reflecting a consistent model-driven selection framework rather than subjective grading.
The portfolio spans multiple sectors, including technology, financials, materials, and consumer industries, demonstrating diversification across asset classes. Most positions show positive returns after selection, with only limited short-term drawdowns. Position weights are typically distributed within a 1%–2% range to maintain balanced risk exposure and structural stability.
The core purpose of Arakawa Quant Picks is to answer three questions: whether the model is effective over the long term, where returns are generated from, and whether the performance structure remains stable across market cycles.
Articles
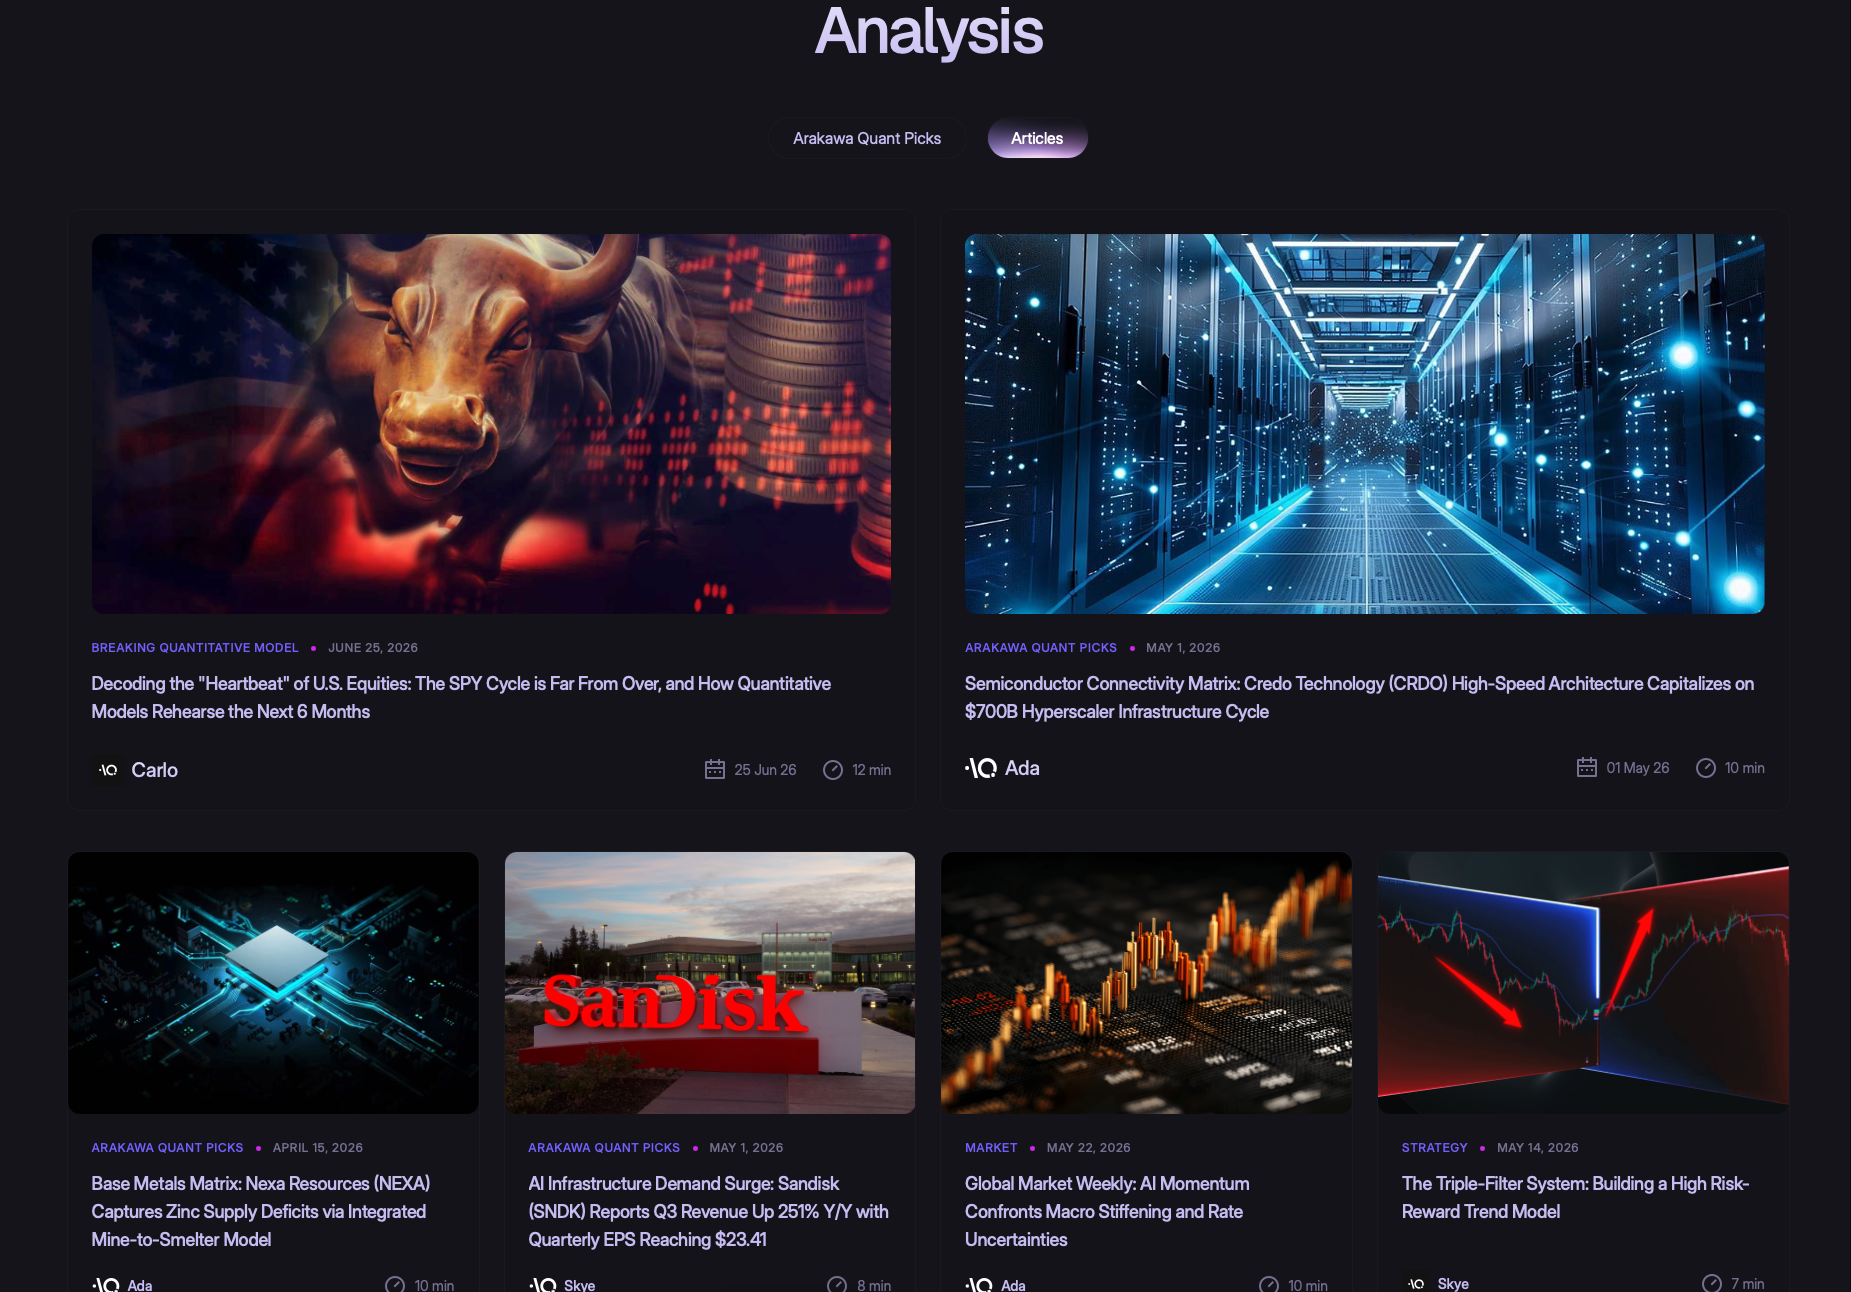
The Articles section serves as the content and research layer of the Analysis module. It provides market information, strategy explanations, and extended analysis of selected assets, acting as a contextual layer for Quant Picks outputs.
This section is divided into three categories.
- Arakawa Quant Picks
The first category consists of analysis articles based on Arakawa Quant Picks, providing deeper explanations of selected assets, including why they were included in the model, the underlying market structure logic, and their role within the portfolio. This effectively breaks down outcomes into their underlying causes.
- Market News
The second category is Market News, which tracks market dynamics and structural changes to help users understand key developments beyond price movements.
- Strategy
The third category is Strategy content, which explains parts of the model framework and logic. These articles do not represent standalone trading systems but are embedded within the broader research framework to enhance understanding of signal generation and asset selection mechanisms.
Overall, articles function as an interpretive layer that transforms quantitative outputs into readable market narratives, allowing users to build a cognitive framework beyond raw data.
Macro Lab (Macro Research Module)
Macro Lab provides systematic macro forward-looking analysis using multi-model quantitative research and statistical testing. It models macro markets structurally to identify trends and assets with statistical advantage.
Its primary role is not short-term price prediction but rather cross-cycle structural analysis, enabling users to identify favorable asset allocation opportunities in broader macro environments.
Quant Lab (Strategy & Data Analysis Module)
Quant Lab allows users to input custom trading code or use pre-built strategy templates to access full-spectrum quantitative data analysis.
It functions as a strategy research and validation environment, enabling users to structure trading ideas and test them against quantitative data, effectively bridging the gap between strategy conception and data-driven validation.
Membership Tiers
Arakawa Quant uses a tiered membership system to accommodate different levels of information depth and signal priority, divided into Silver and Gold tiers.
Silver members have access to basic Quant Signals and Analysis content, including standard trading signals, Market News, and baseline asset analyses for daily trading reference.
Gold members receive higher-priority Gold Signals along with deeper market insights and advanced research content. These signals are derived from stricter multi-model filtering processes and offer higher conviction levels and more detailed analytical support.
Overall, membership tiers do not change the system structure but instead adjust information density and priority levels, creating a layered decision-support framework.
Standard Usage Flow
While Arakawa Quant does not enforce a rigid workflow, users typically follow a structured sequence from signal identification to market validation and then execution monitoring to ensure decision consistency.
Users usually begin in Quant Signals by reviewing Gold and Silver Signals to identify actionable opportunities. These signals define directional bias and key price structures for potential trades.
They then move to the Analysis module to validate the market environment. Arakawa Quant Picks provides historical performance context and asset selection logic, while Articles (including Market News, selected asset analyses, and Strategy content) provide market dynamics and contextual explanations to assess whether current conditions are suitable for execution.
After signal identification and market validation, users can use Signal Monitor to track real-time signal evolution and adjust positions accordingly.
This workflow is designed as a multi-layer decision system integrating signal identification, environmental validation, and dynamic monitoring.
Risk Disclosure
All signals are generated based on historical data, statistical models, and market structure analysis. They do not constitute any form of profit guarantee or investment advice. Due to the inherently uncertain nature of financial markets, users should strictly manage position sizing and risk exposure.
It is generally recommended to limit risk per trade to 1%–3% of total capital, avoid excessive concentration across multiple signals, and reduce trading frequency during high-volatility conditions to maintain overall strategy stability.
Arakawa Quant continuously evolves its quantitative models and market analysis framework to maintain the consistency and relevance of its signal structure and research content.
In a market bound by stagflation and structural shifts, alpha is no longer found in consensus narratives. It belongs to those who exploit information asymmetry at the intersection of macro drivers and code.
AQ Team
Arakawa Quant Research Team
Subscribe to our newsletter
Get the insider insights you need to scale, straight to your inbox.




Decode the Market. Quantify Your Edge.
Elite quantitative models and real-time execution signals. Trade with institutional power.

Copyright © 2026 Hong Kong Arakawa Limited. All rights reserved.


%2C%20Color%3DNegative.svg)