Search All
Candle Range Theory (CRT): Unlocking Trading Potential Behind Single Candles


Why CRT? A Micro-Perspective Beyond Macro Structures
In technical analysis, traders often rely on swing highs and lows to define market structure. However, this traditional approach is often too macro, missing precise entry opportunities hidden in micro-structures. Candle Range Theory (CRT) posits that every individual candle holds its own complete price range. Technically, this is logical: when viewing a daily candle on a one-hour timeframe, the wicks represent the swing low and swing high, forming an isolated micro-structure. CRT allows traders to position themselves within minimal risk zones at the exact moment of trend conversion. By integrating this with Smart Money Concepts (SMC), a single candle evolves into a high-probability trading unit.
The Five-Step Framework of CRT
To transform CRT into an actionable system, we follow a five-step framework:
Step 1: Identify Trade Setups.
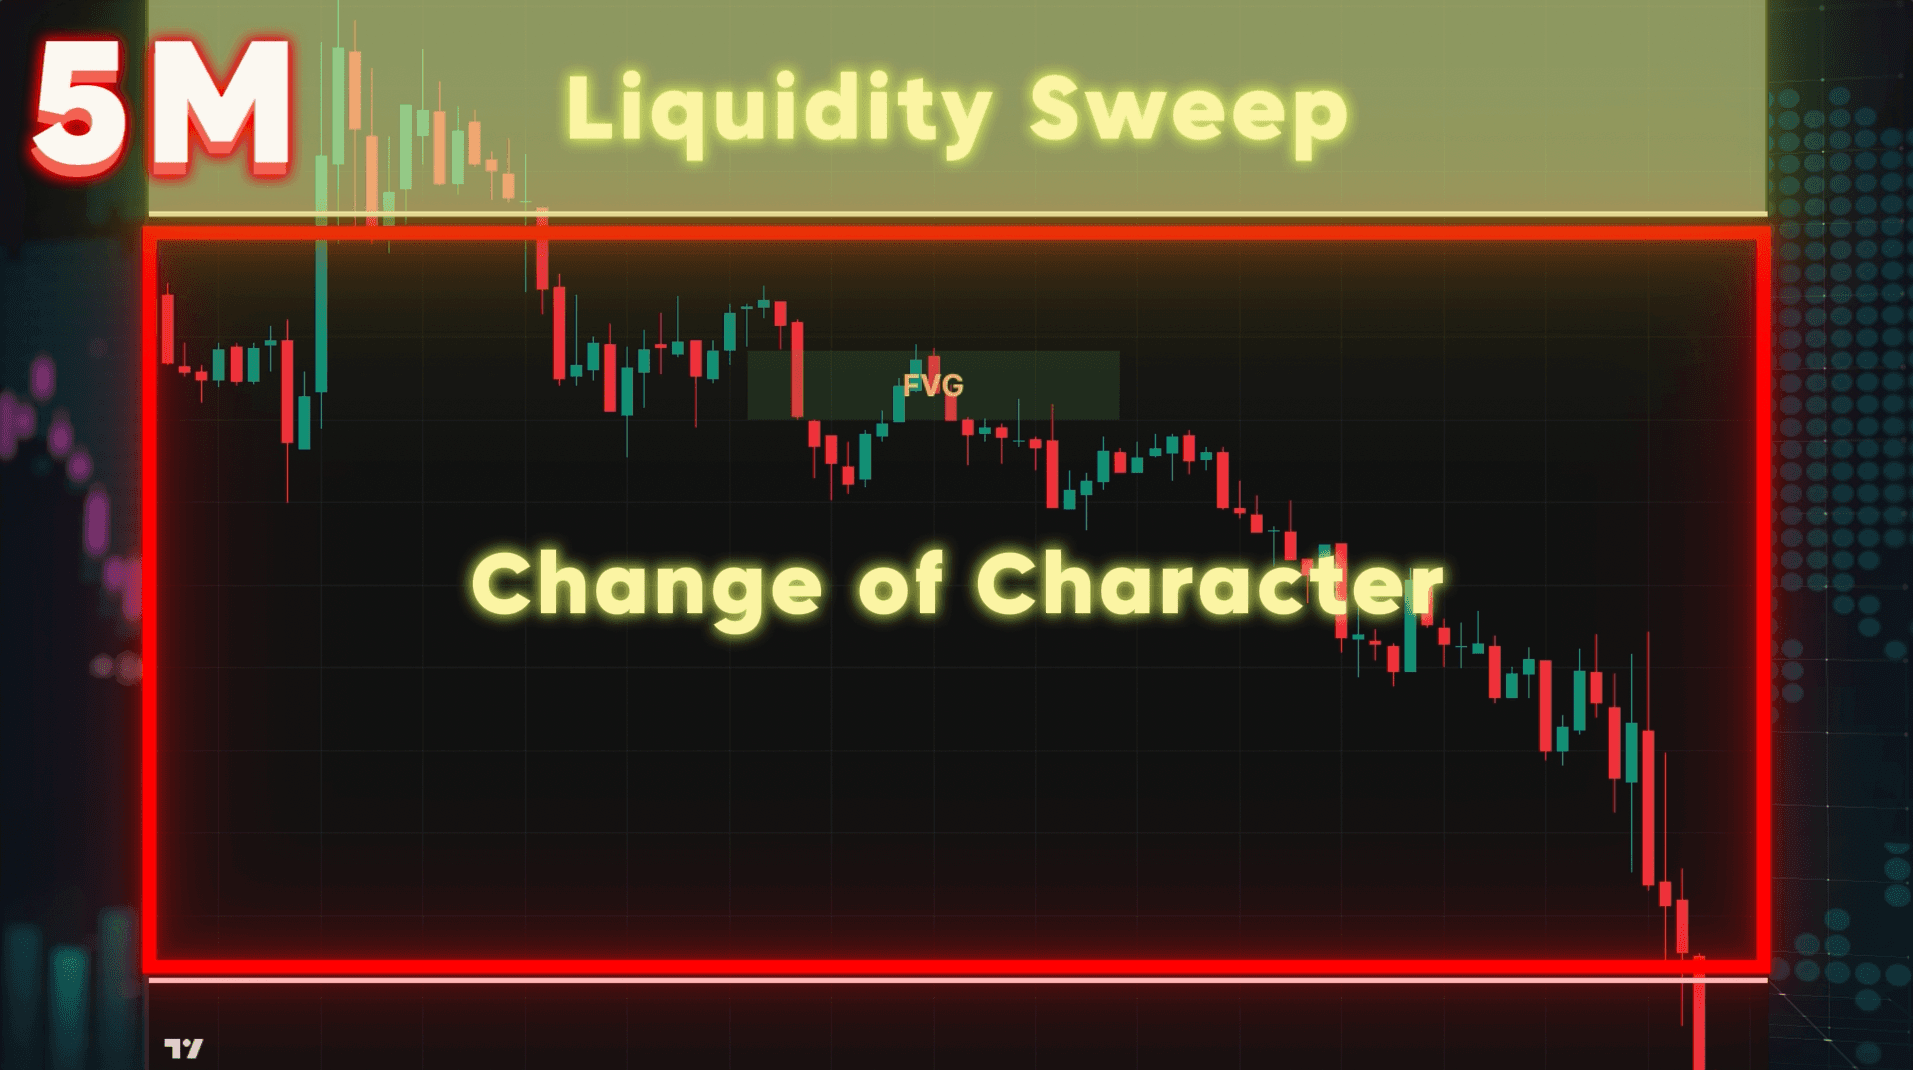
A typical CRT strategy involves a three-candle setup, where each candle plays a specific role. Traders must observe whether price is drawing into specific PD Arrays (Price Delivery Arrays), such as a Fair Value Gap (FVG). Visualizing price data with high precision is critical for locating the trend's origin.
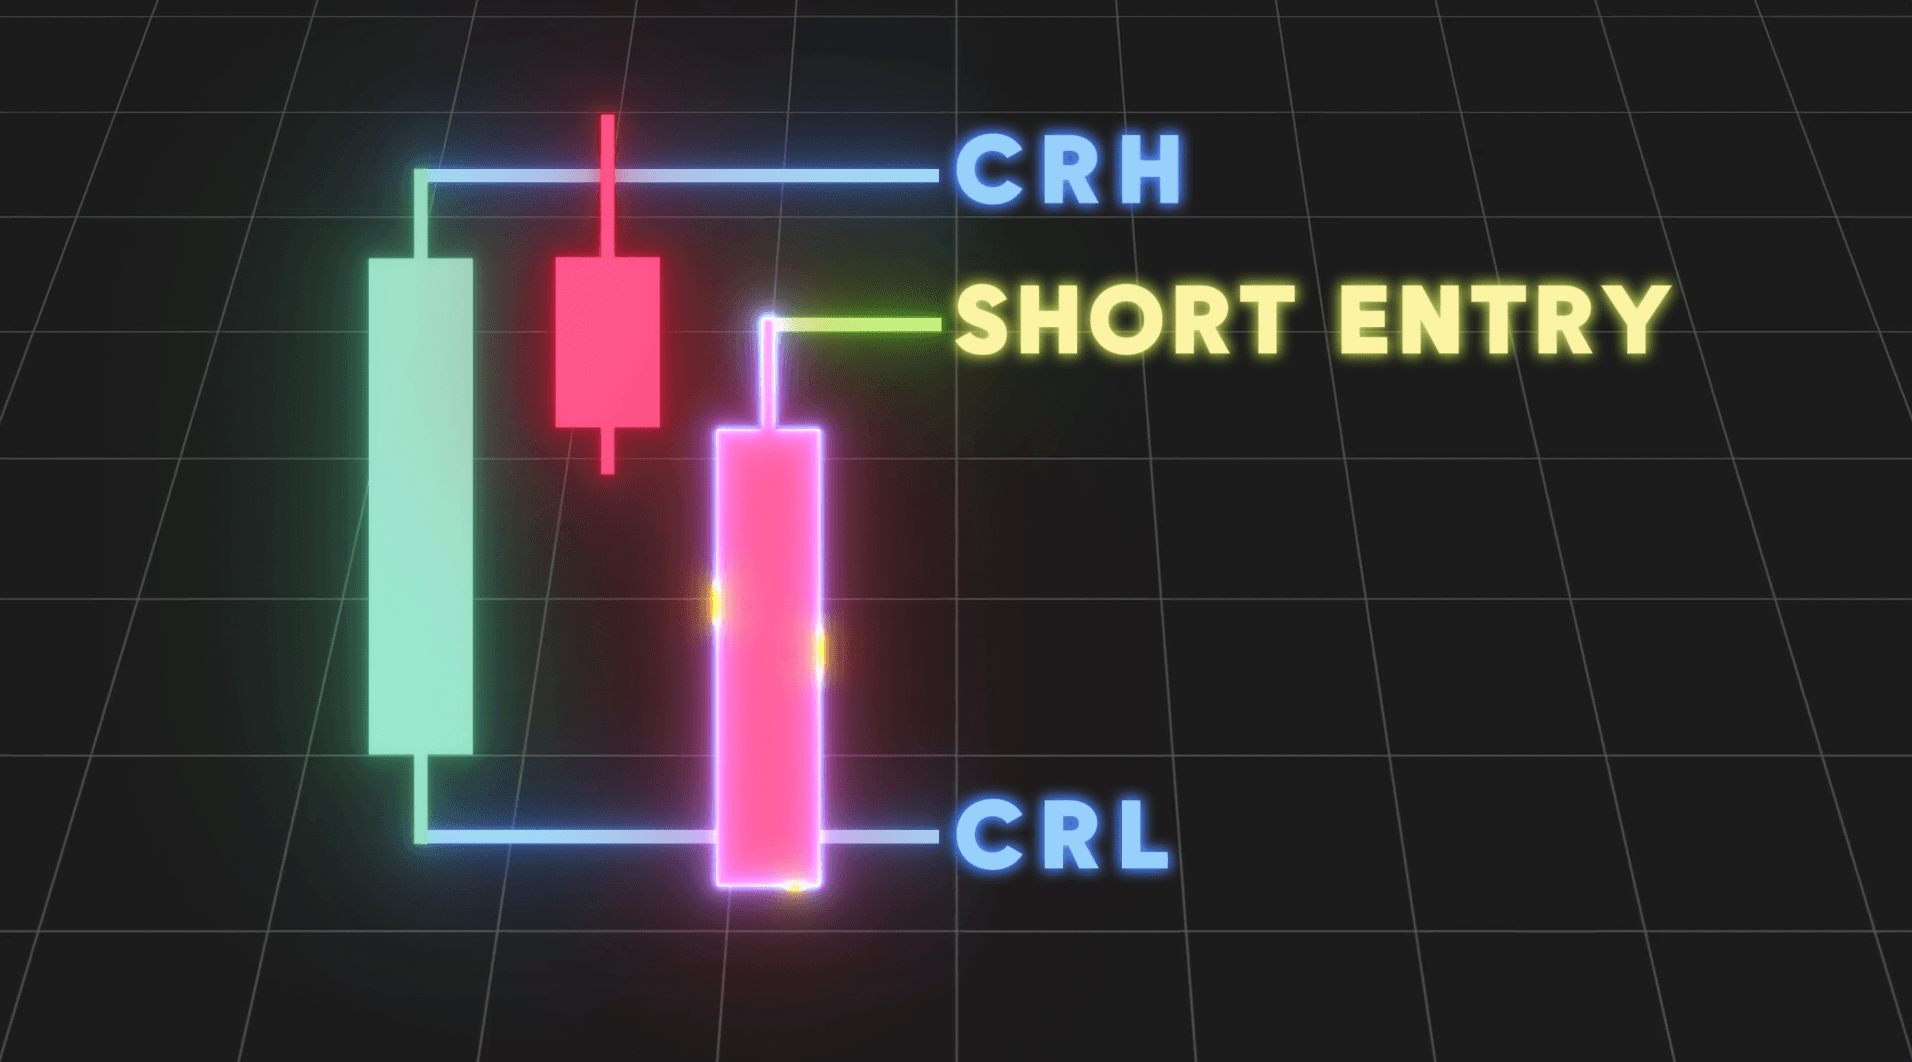
Step 2: Confirm Reversal Signals.
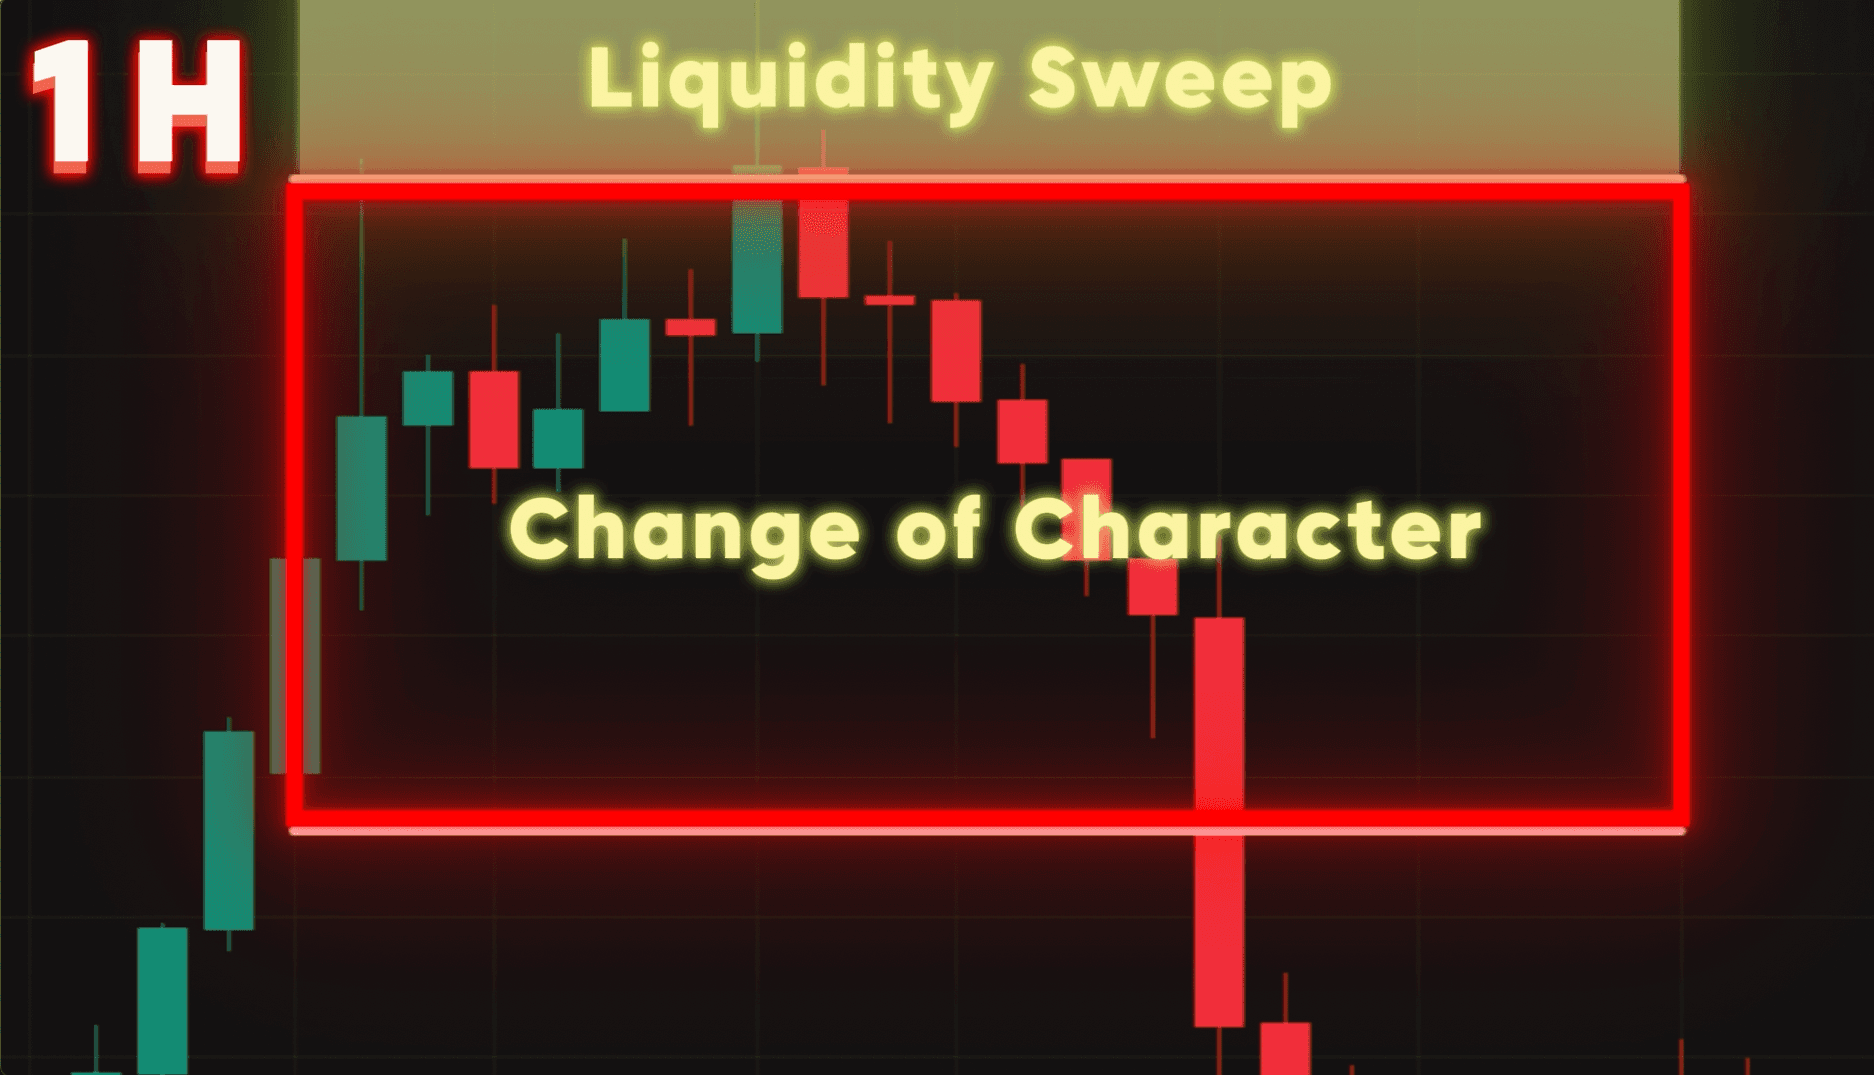
CRT functions primarily as a signaling method to predict directional reversals. This makes it an exceptional tool during "Liquidity Attacks," enabling traders to analyze in real-time whether the market is engaged in a "Liquidity Run" or a "Liquidity Sweep."
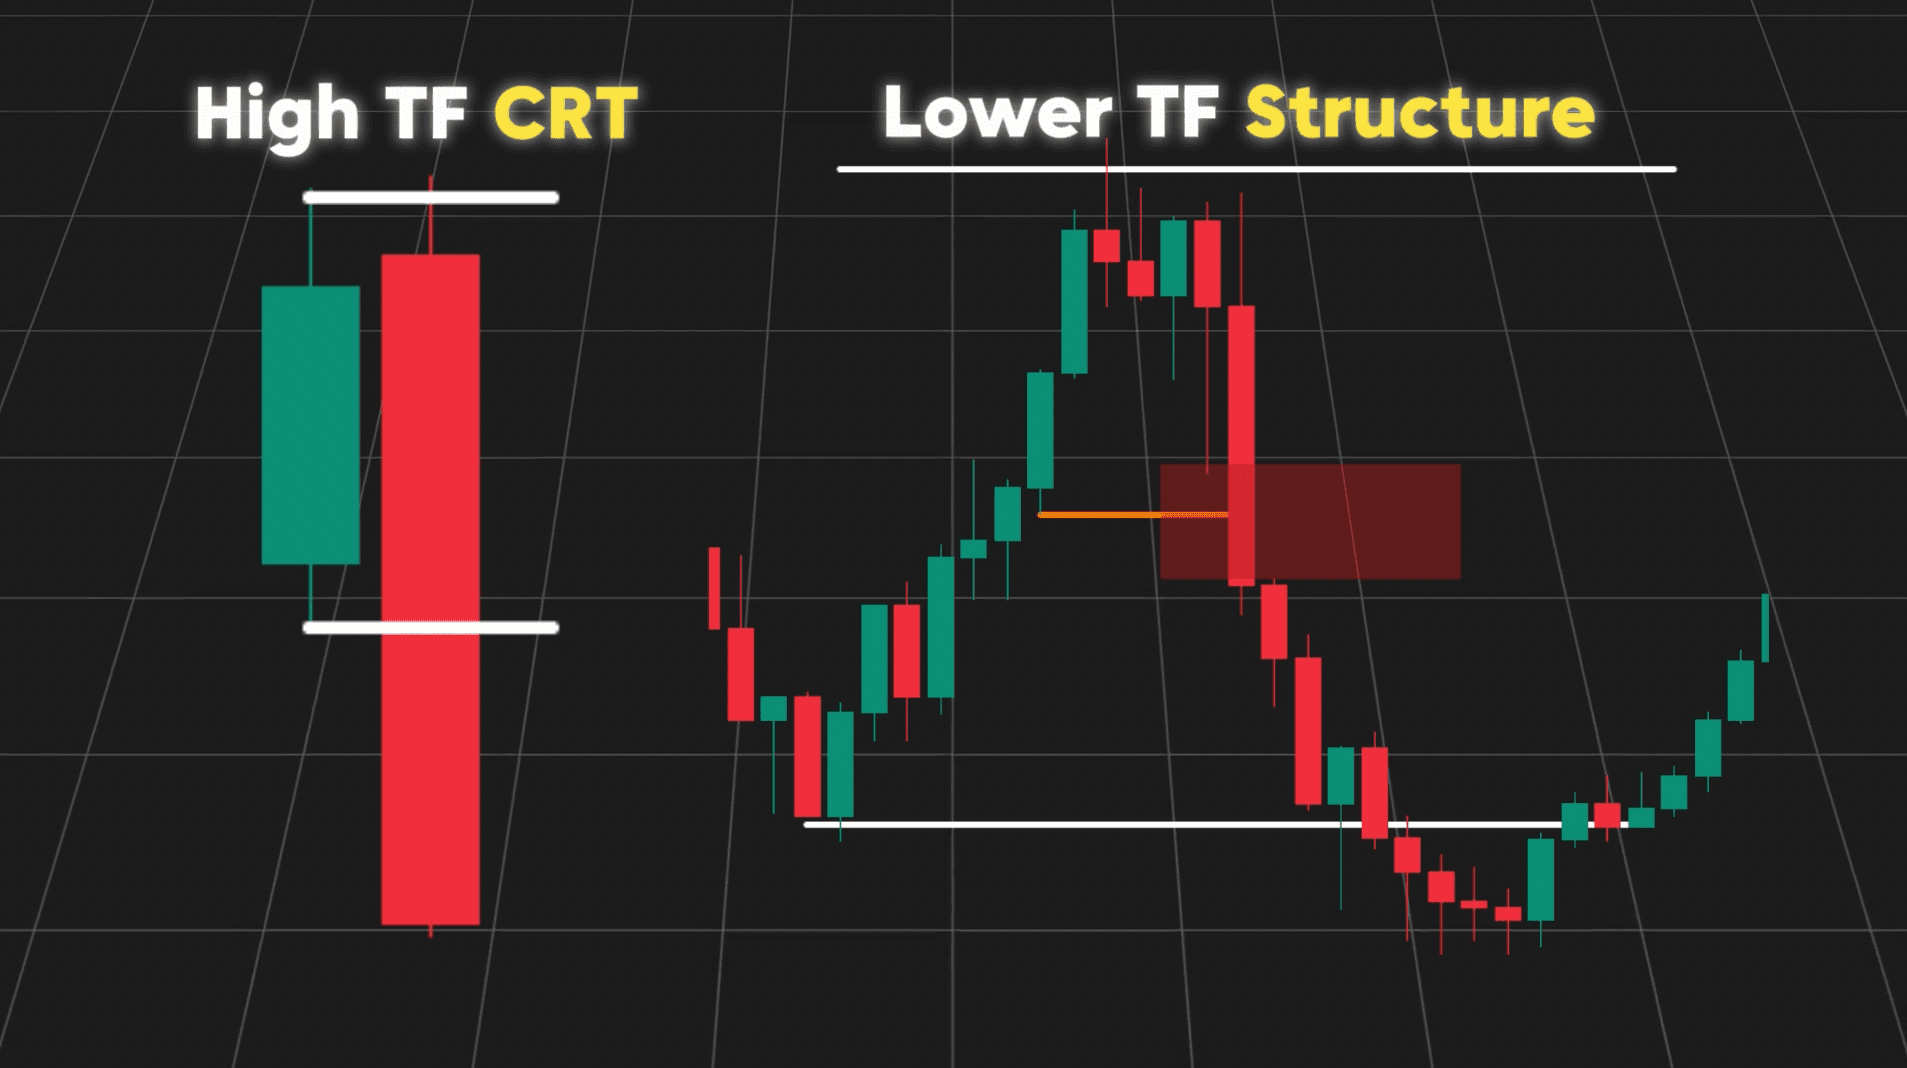
Step 3: Timeframe Resonance.
Never trade solely on a higher timeframe. CRT mandates an assessment of lower-timeframe market structure to validate the market’s intention. Only when the higher-timeframe reversal signal resonates with lower-timeframe structure does it constitute a high-probability entry point.
Step 4: Validate PD Array Respect.
When price enters a PD Array, such as an FVG, CRT serves as a confirmation tool. After a Change of Character (CHoCH), traders should anticipate a reversal from this zone. Using CRT to confirm whether this FVG is being "respected" by the market is the final verification of a setup's validity.
Step 5: Risk Management and Disciplined Execution.
In the CRT model, stop-loss levels are placed outside the candle range, targeting a reward-to-risk ratio of at least 2:1. This disciplined risk structure is the foundation of long-term profitability.
Conclusion: Finding Market Advantages Through Data
Candle Range Theory is not a fortune-telling tool; it is a precise method for identifying reversal momentum. By treating each candle as an independent range, traders gain clarity on the micro-details of liquidity fluctuations. Trading is a marathon; consistent profit is the byproduct of a standardized execution system rather than speculative prediction.
Thank you for your subscription and support. We will continue to share in-depth market analysis and practical trading tutorials. Stay tuned for our upcoming professional updates.