
Search All
Decoding the "Heartbeat" of U.S. Equities: The SPY Cycle is Far From Over, and How Quantitative Models Rehearse the Next 6 Months


In this quantitative research series, we incorporate a comprehensive review and deep-dive analysis of the newly released report, titled "SPY Periodic Cycle Analysis - Is the Cycle Over?". Leveraging advanced mathematical regime diagnostics and cross-asset confirmation frameworks, this report establishes an exceptionally rigorous quantitative foundation for localizing the current cyclical position of the U.S. equity market.
We can conceptualize this analysis as a meticulous "multidimensional cyclical health check" for SPY (S&P 500 ETF). Rather than drawing conclusions from a single indicator, it employs seven distinct quantitative tools for mutual cross-verification. The goal is to eliminate noise as much as possible and clearly discern exactly where the market currently stands within its "macro-rhythm."
What does this "checkup" measure?
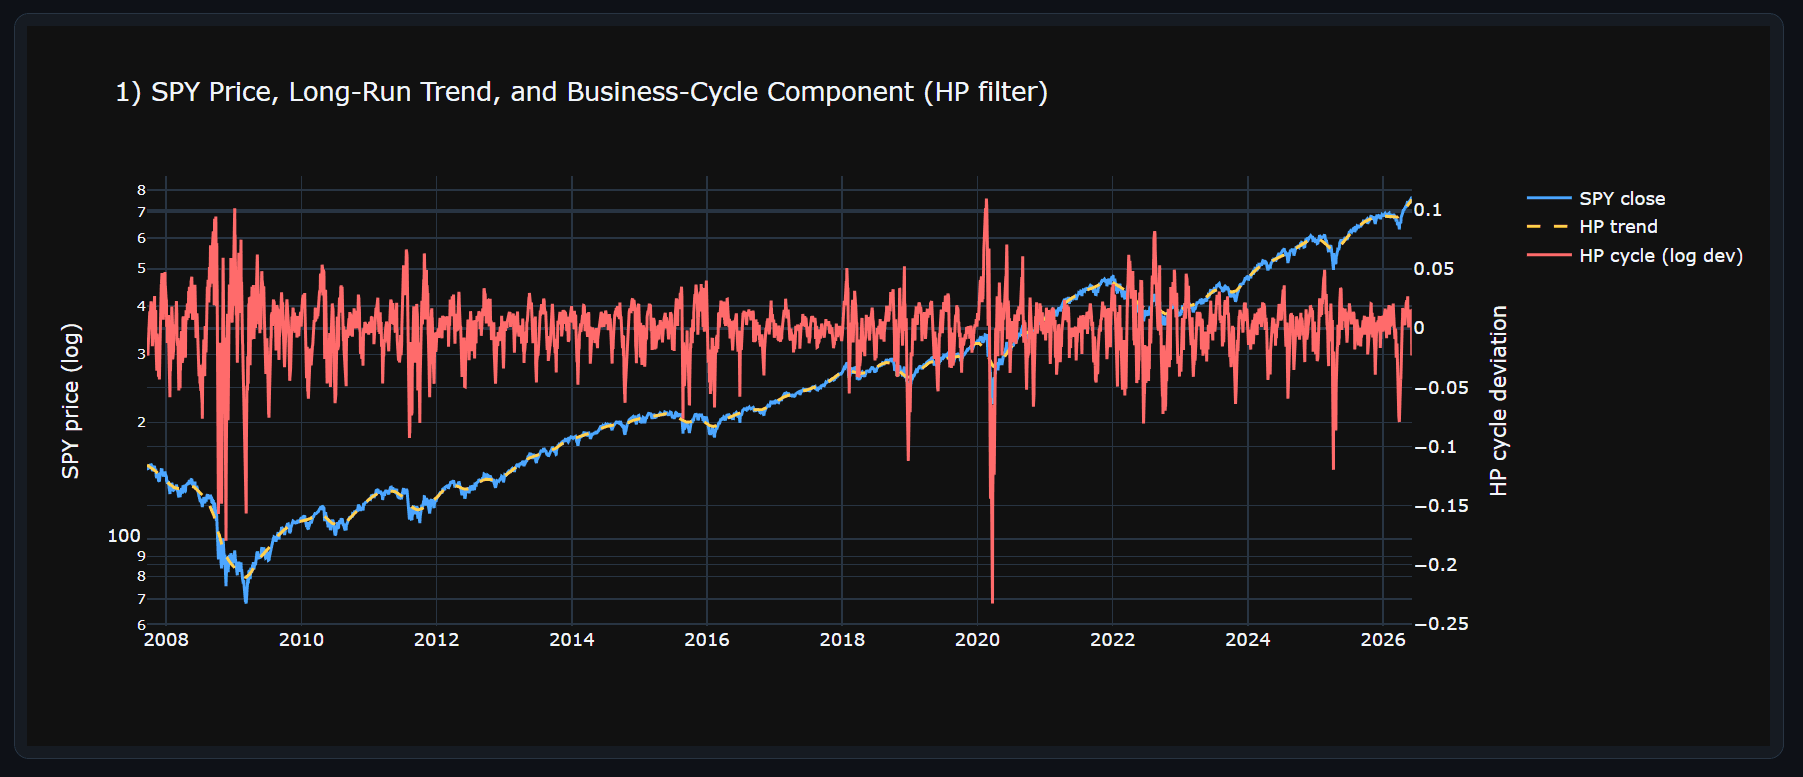
First, the Hodrick-Prescott (HP) filter is applied to decompose the log SPY prices into a long-run trend and a medium-to-short-term cyclical component, revealing the underlying structural movements.
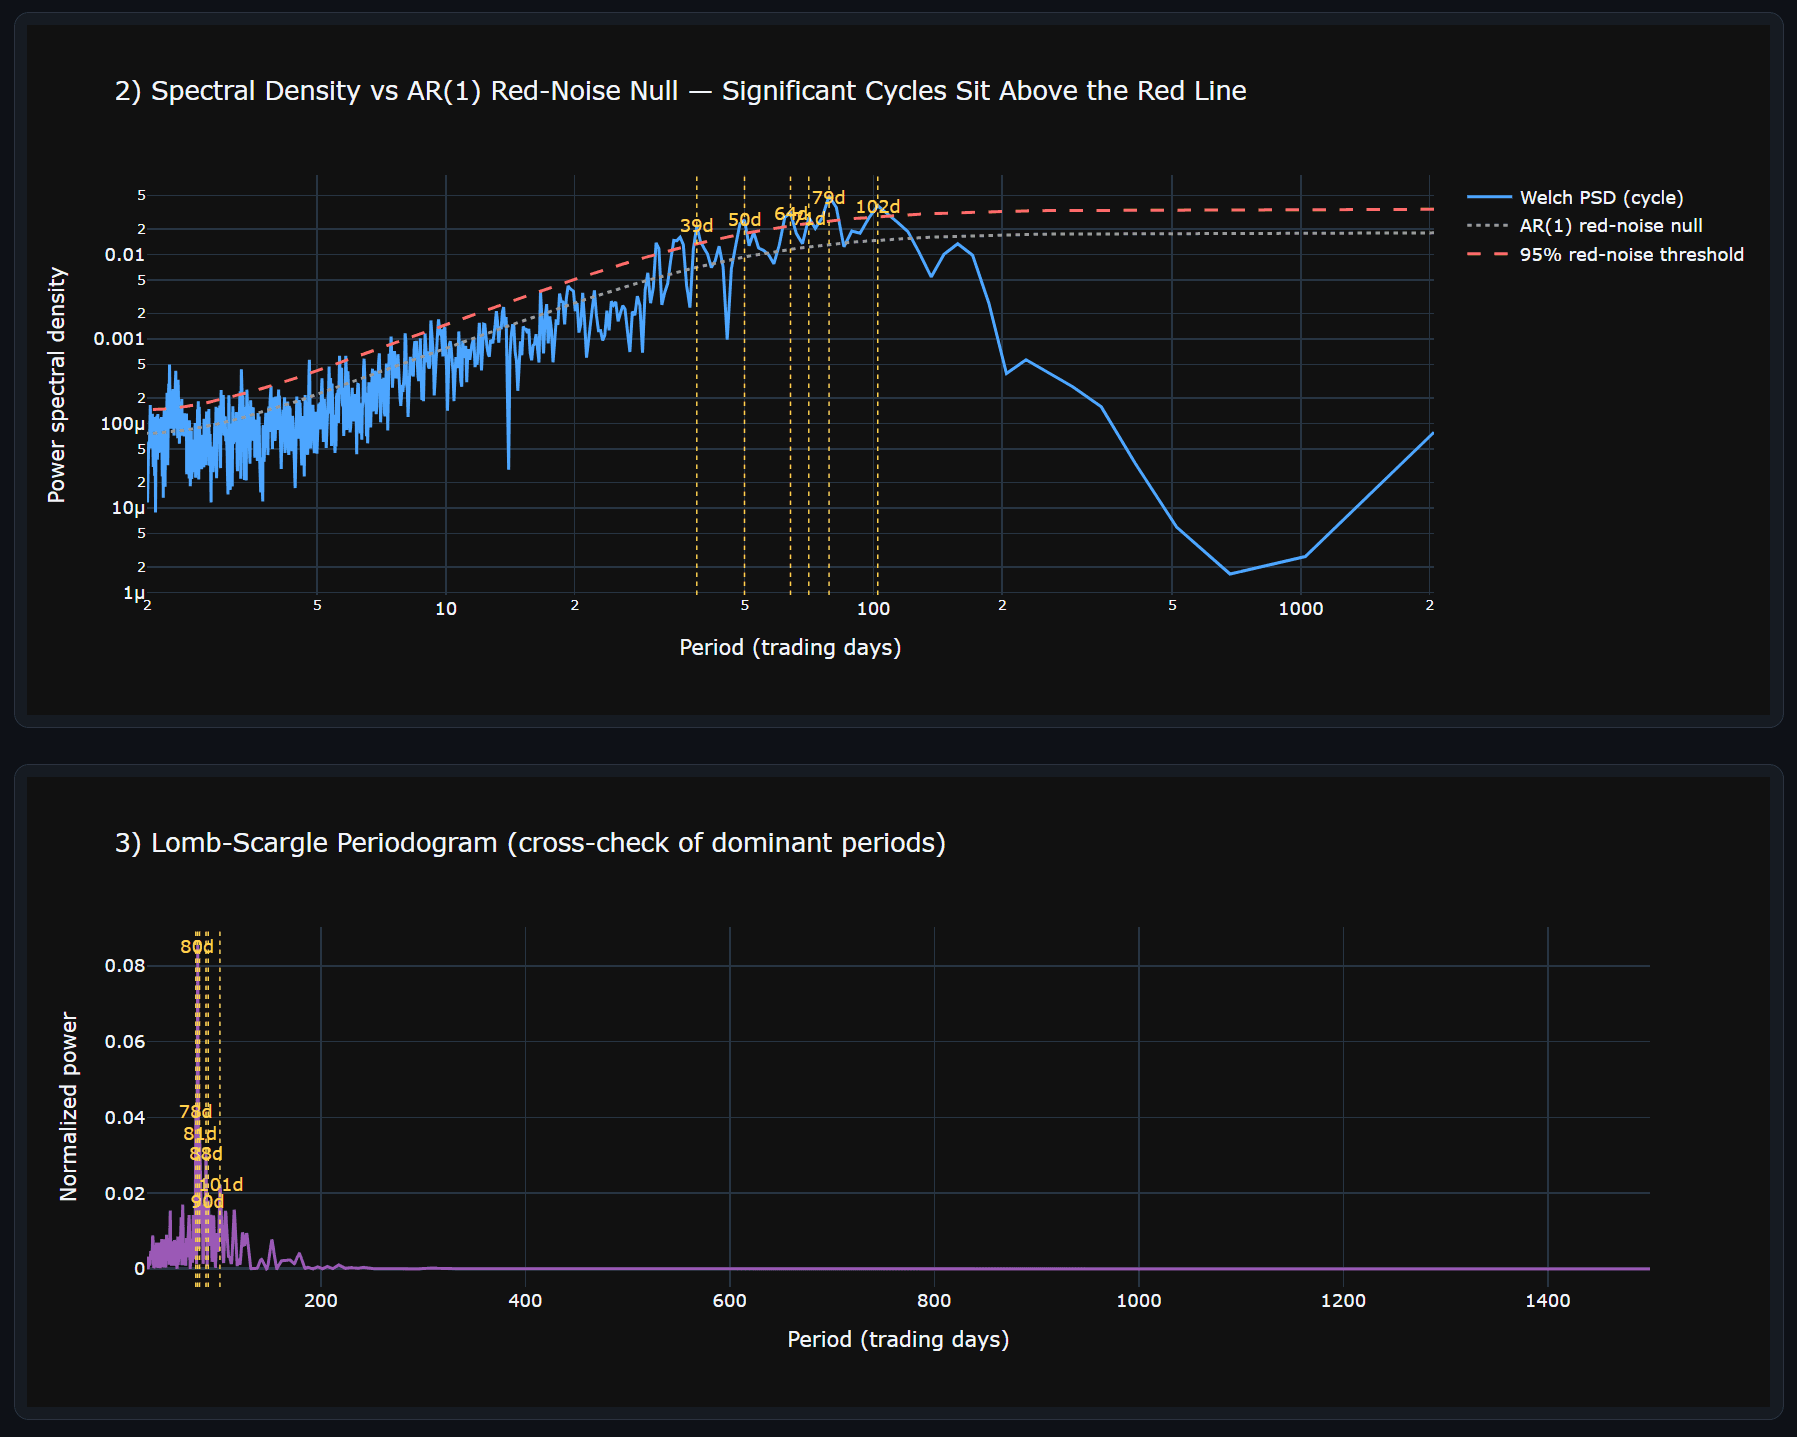
Then, Welch Power Spectral Density (PSD) and Lomb-Scargle periodograms are cross-verified against an AR(1) red-noise null. Only peaks exceeding the 95% threshold are treated as genuine, statistically significant cycles, ensuring they are not illusions born of a random walk.
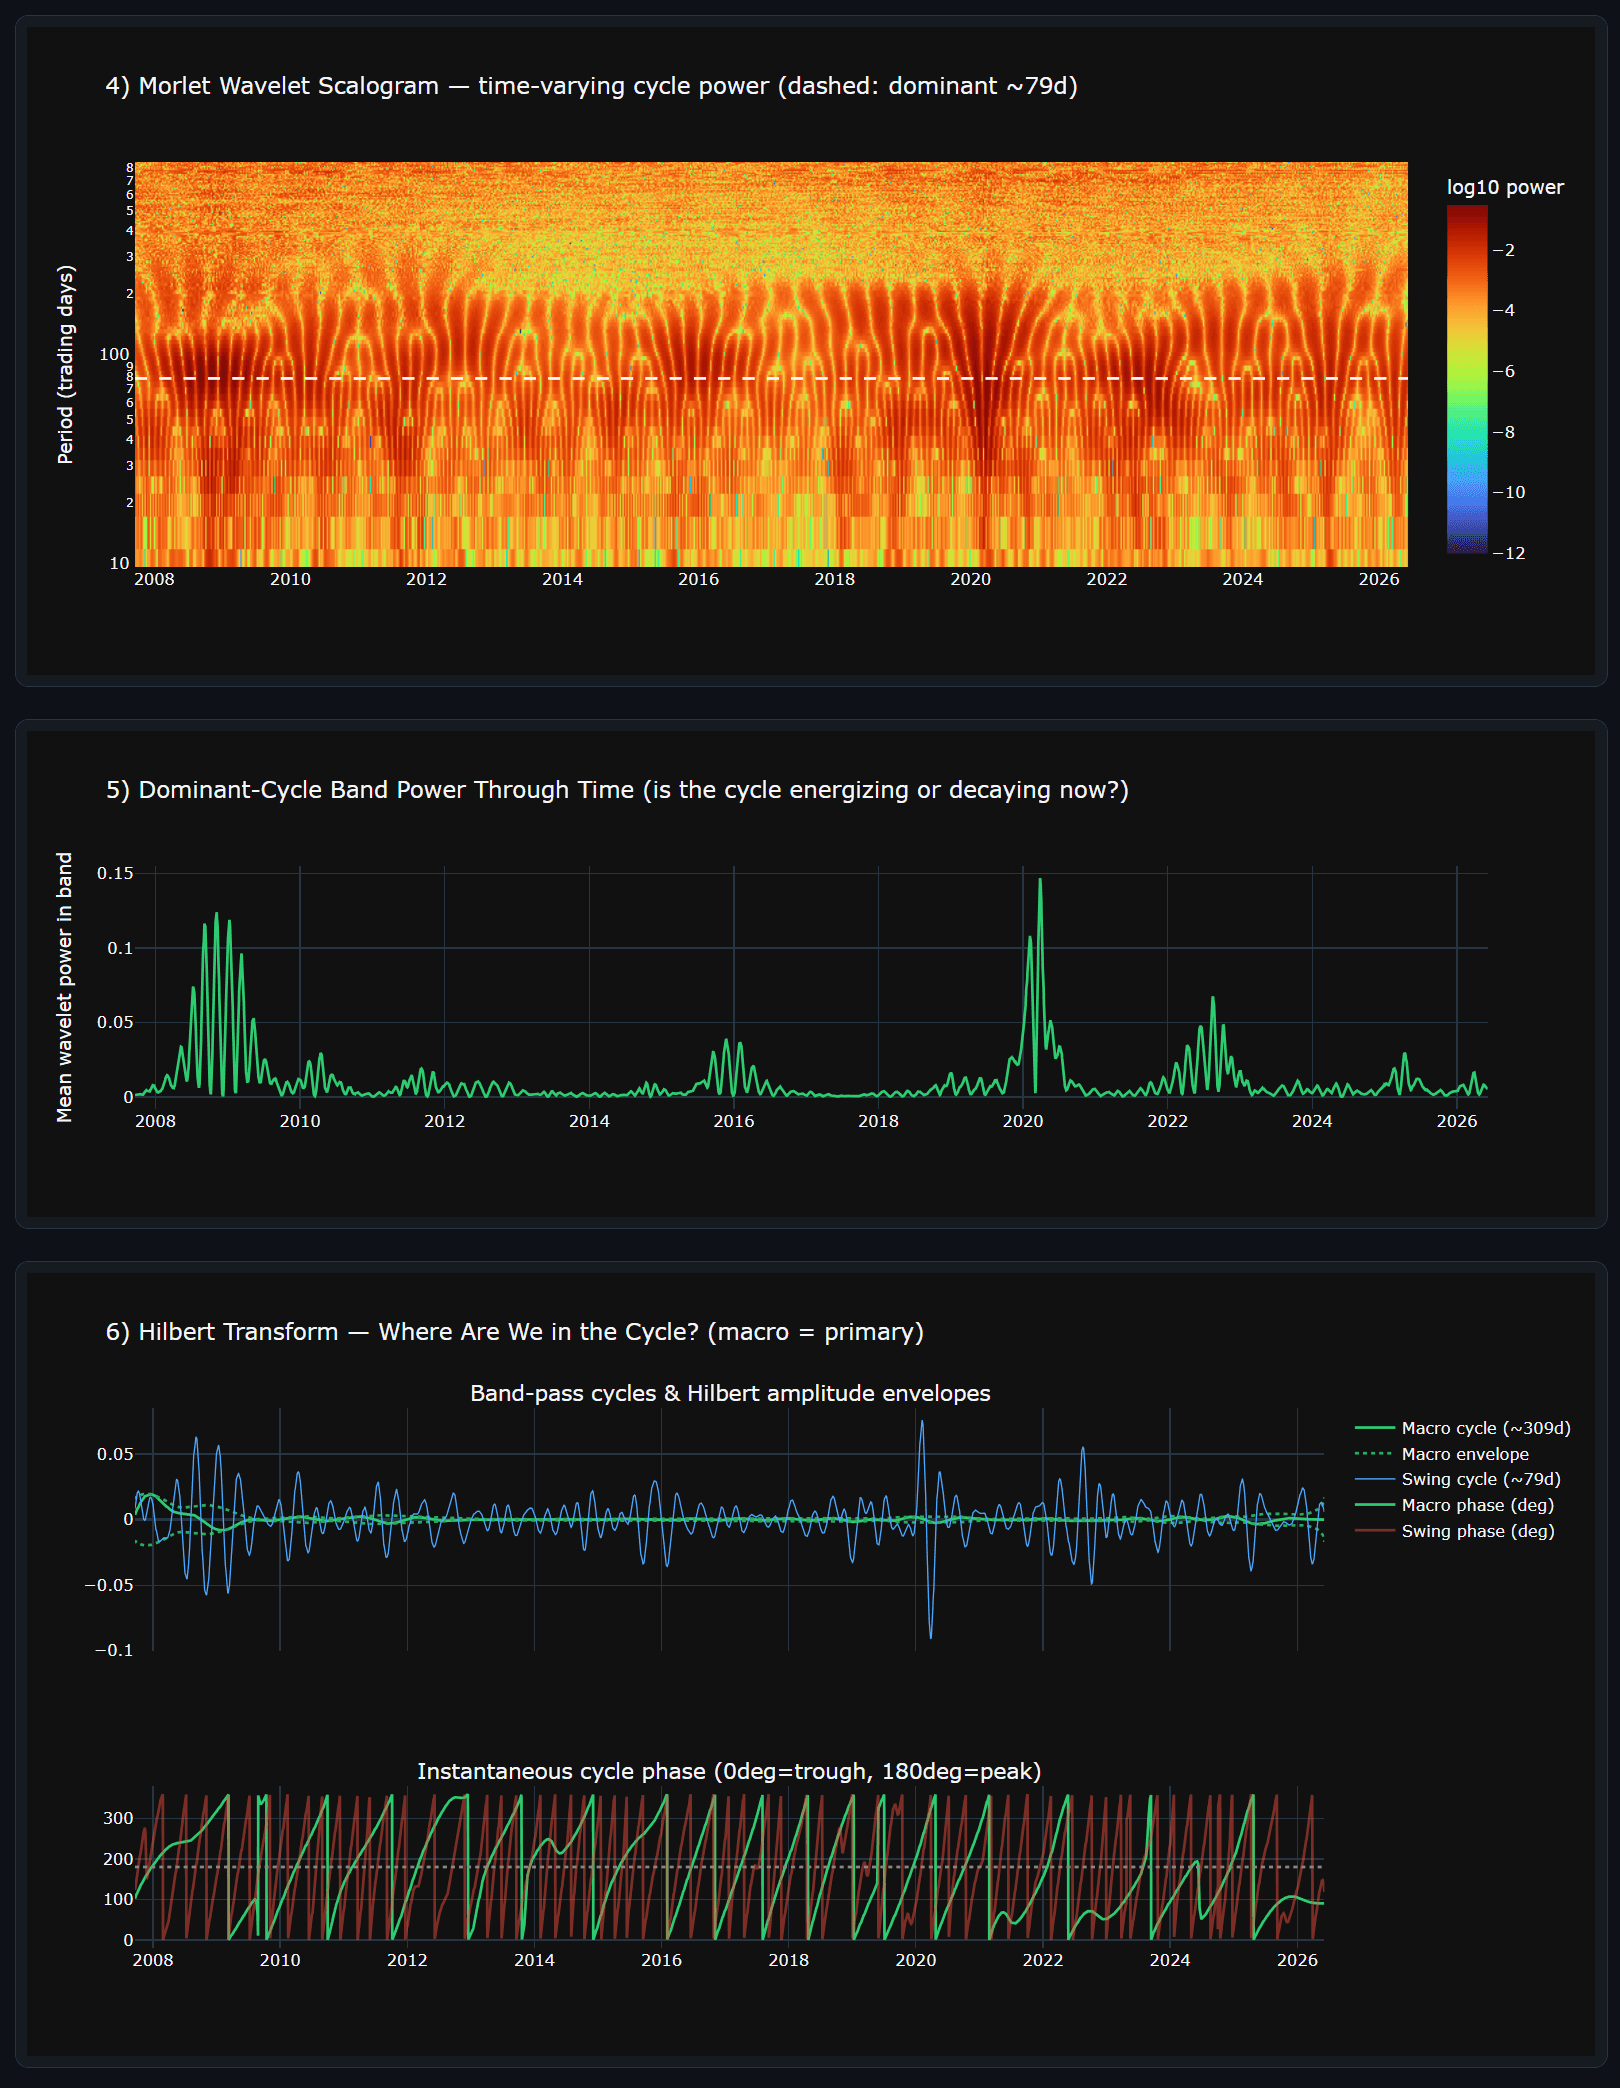
A Morlet Continuous Wavelet Transform (CWT) maps the time-varying power of these cycles to observe whether energy is accumulating or decaying. Concurrently, a band-pass filter combined with the Hilbert Transform extracts the instantaneous phase, precisely localizing our current position (trough, rising, peak, or falling).
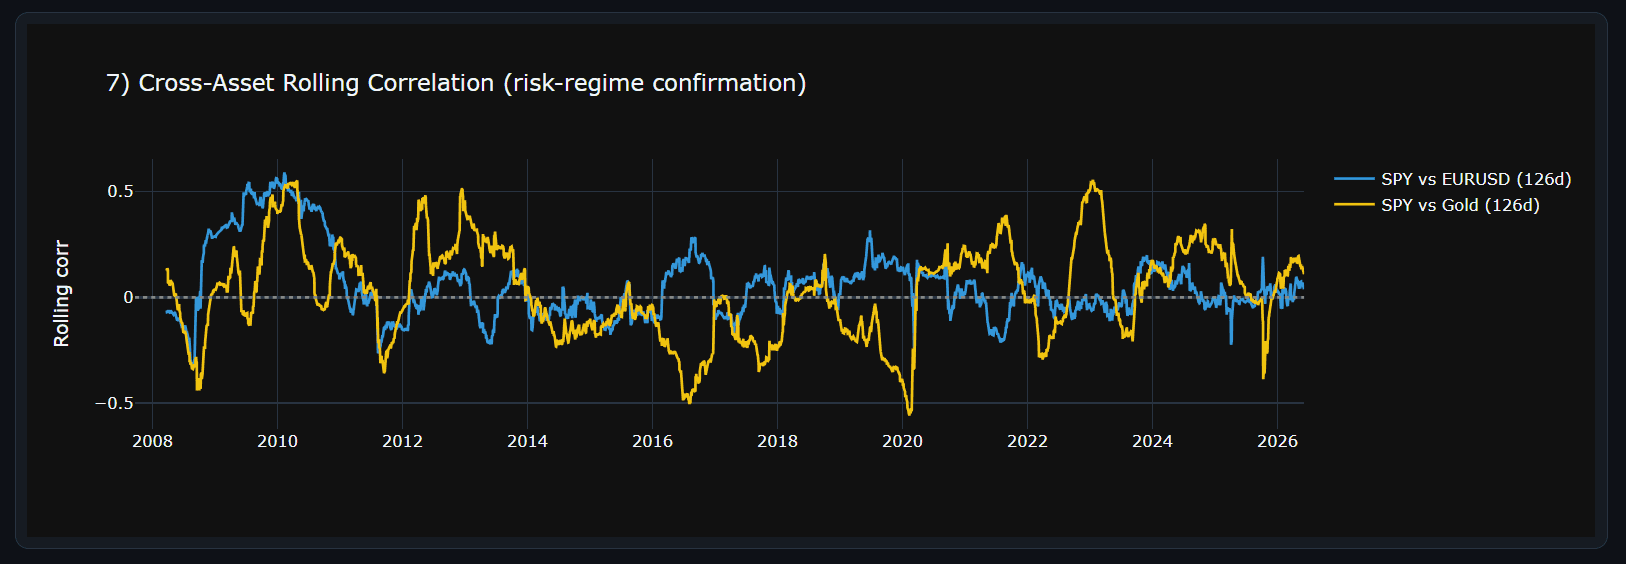
Finally, the Hurst exponent (R/S analysis) determines whether the recent market regime is trend-persistent or mean-reverting, while rolling correlations with EURUSD and Gold check for any risk-aversion divergences typically observed before major cyclical tops.
The core conclusion of the "physical examination report", in layman's terms, is this:
The Primary "Heartbeat" Identified
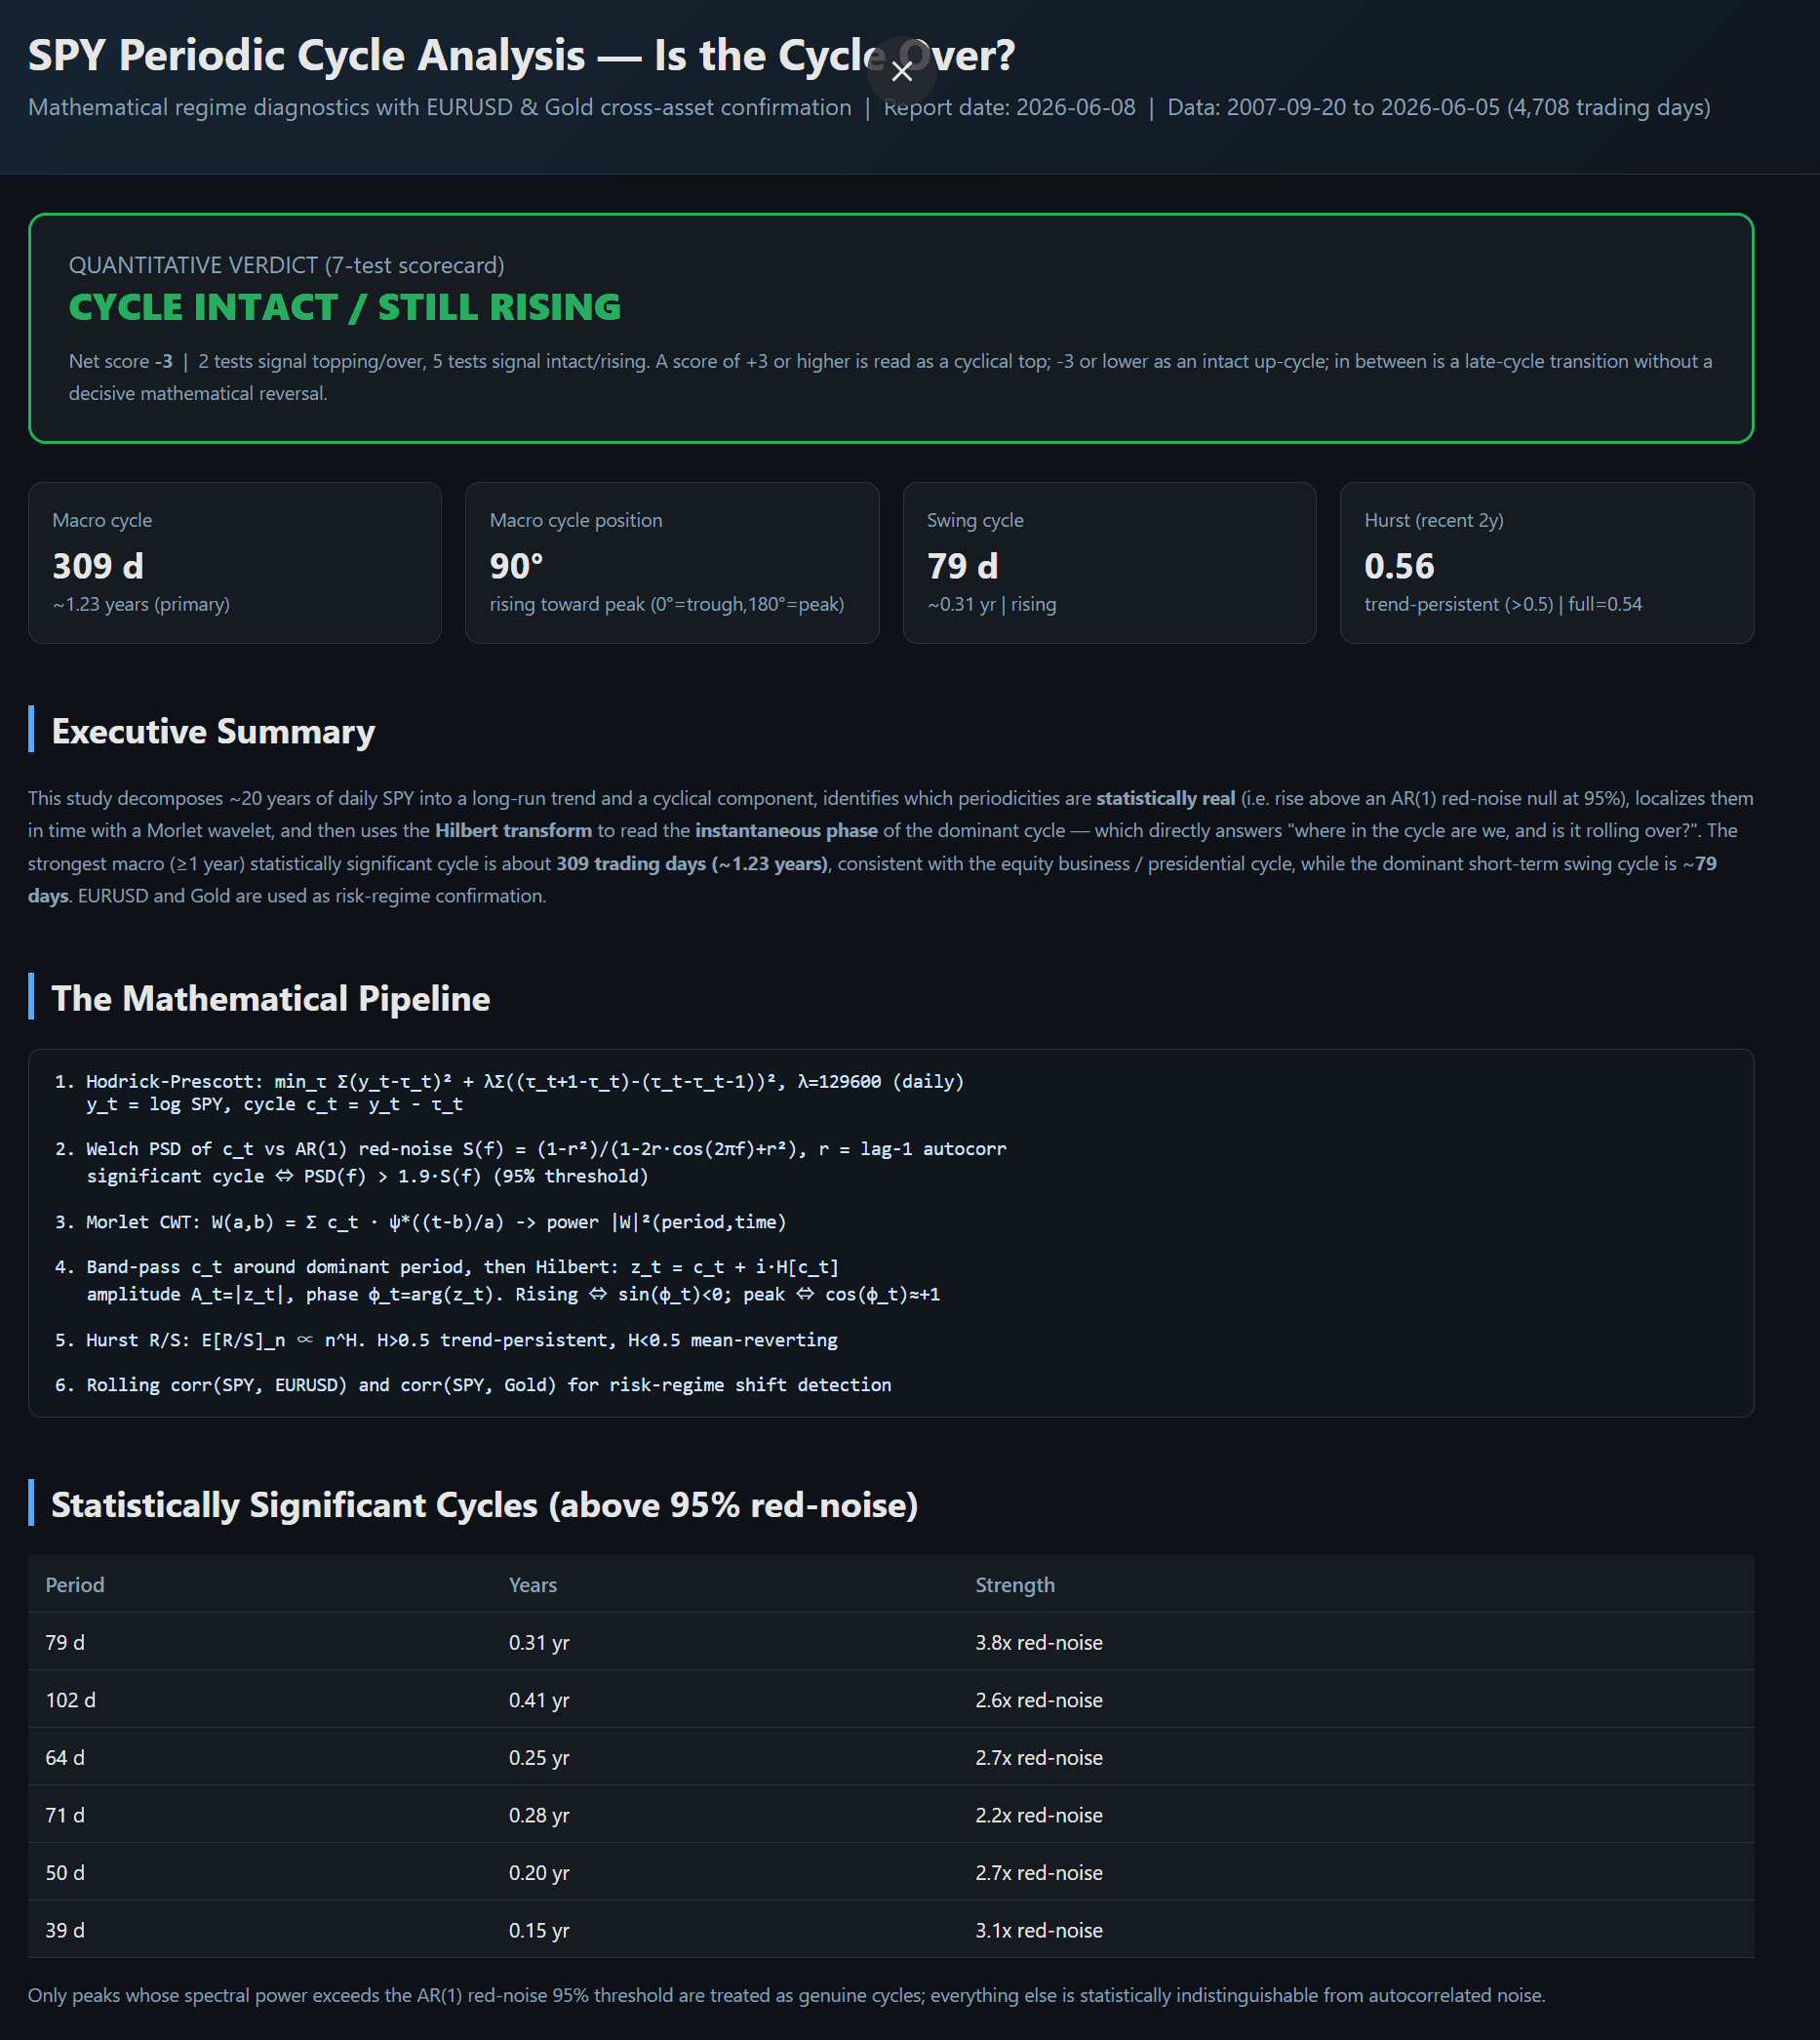
The most statistically significant and regular macro rhythm is ~309 trading days (~1.2 years). Additionally, shorter-term swing cycles exist, with the strongest anchoring around 79 trading days.
Where Are We in the Cycle? Halfway Up from the Trough
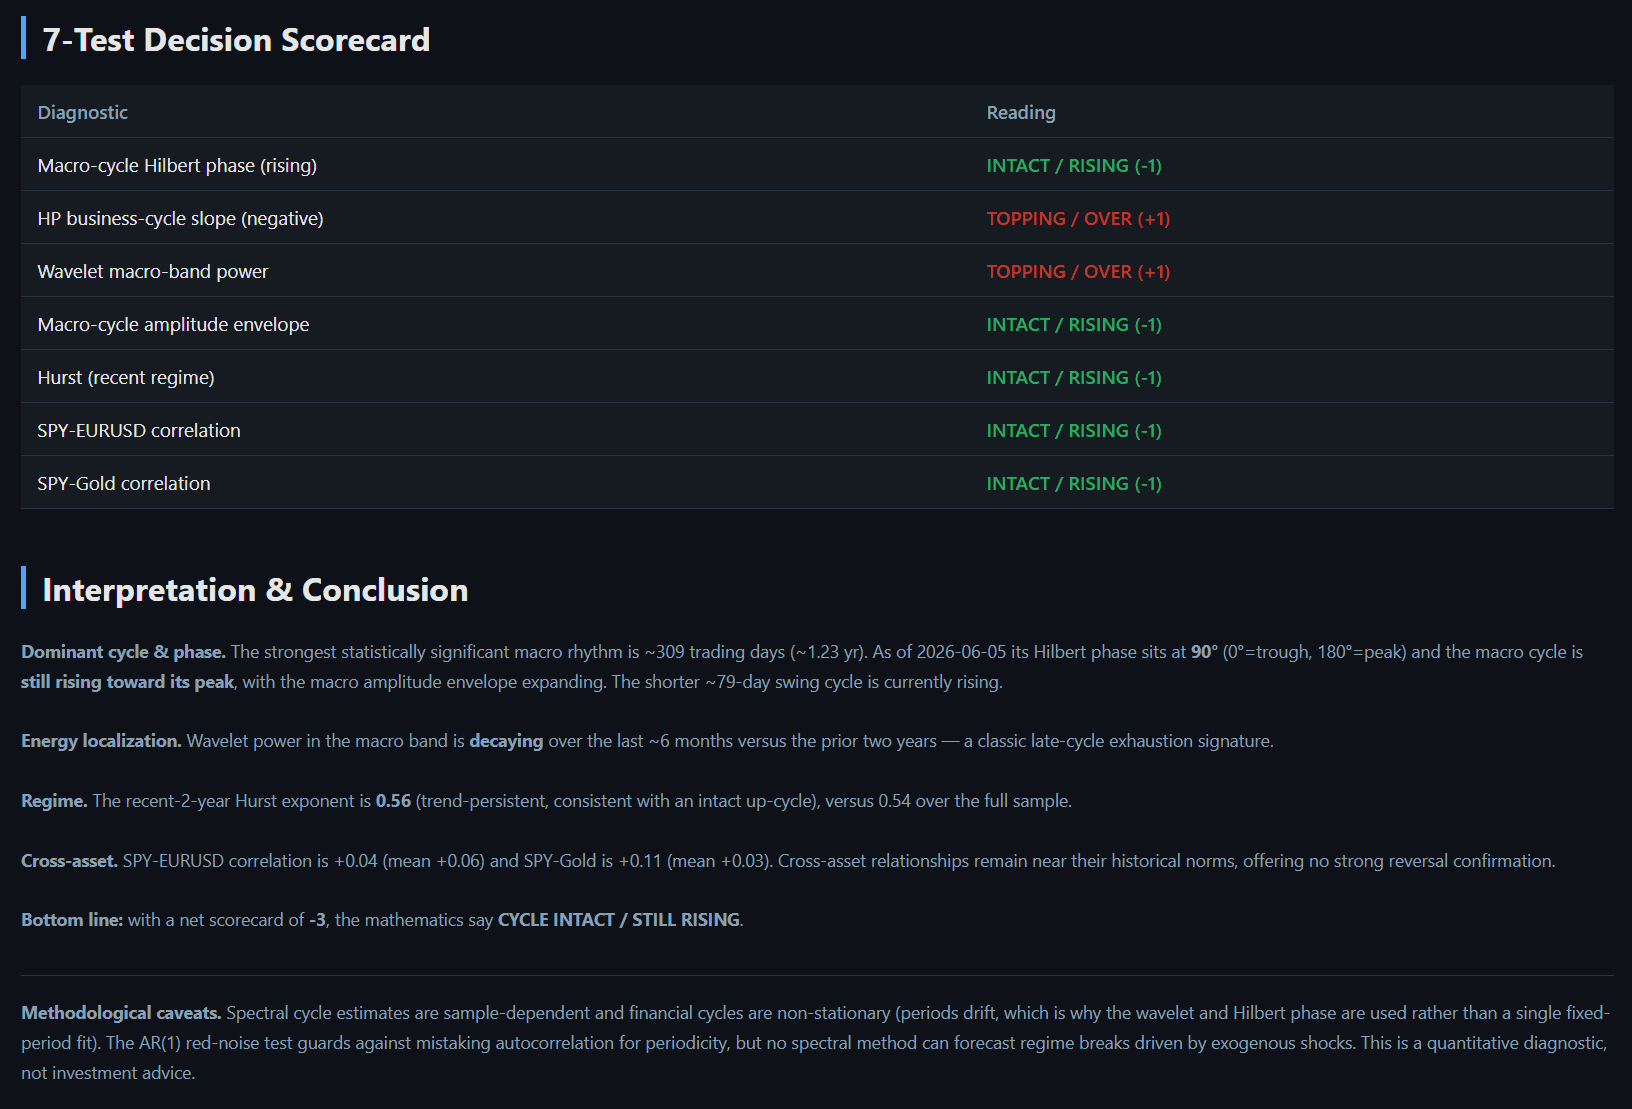
If we compare a full cycle to a clock face where 0° is the trough and 180° is the peak, the macro cycle's Hilbert phase currently sits precisely at 90°. This means the market has cleared the trough and is in the middle of climbing toward the peak; it is far from rolling over.
The Upward Stamina Remains; No Sign of Exhaustion
The recent 2-year Hurst exponent is 0.56/0.57 (trend-persistent when >0.5), showing that the market currently favors continuing its established path over abrupt reversals, which self-consistently supports the "still rising" thesis. Concurrently, while wavelet power in the macro band shows some decay over the past 6 months compared to the prior two years (a classic late-cycle exhaustion signature), the macro amplitude envelope is still expanding, indicating the baseline momentum of this upward leg has not dissipated.
No Danger Signals from Cross-Asset Relationships
Typically, prior to a major secular top, asset relationships begin to diverge—for instance, equities rally while correlations with EURUSD or Gold warp strangely. Currently, SPY's correlation with EURUSD (+0.04 vs mean +0.06) and Gold (+0.11 vs mean -0.03) remains near historical norms. The absence of a "risk-off" divergence suggests that the current equity rally has not transformed into a dangerous, unconfirmed late-stage spike.
Summary Score: The Cycle is Highly Unlikely to be Over
Evaluating through our objective 7-test scorecard yields 5 signs of an intact cycle and 2 early warnings of potential topping. The net result strongly leans toward an uncompleted cycle. Thus, the mathematical models dictate: CYCLE INTACT / STILL RISING.
While static diagnostic metrics offer invaluable structural insights, they must be augmented with forward-looking simulations to guide tactical execution. To project the market's subsequent trajectory with higher probabilistic confidence, we incorporate the secondary framework defined in the "SPY 6-Month Probabilistic Forecast" segment. Stripping away subjective biases, this predictive model anchors itself upon a 20,000-path block-bootstrap Monte Carlo engine and rigorous conditional phase analogs. In the following sections, we dissect the explicit probability distributions and risk horizons derived from this forecasting report.
Instead of guessing, we "rehearse the future" using three distinct lenses.
Imagine you are a director filming a "documentary of possibilities" for SPY over the next six months. Rather than filming a single narrative, we run massive rehearsals to see how different scripts unfold. We deploy three independent modeling methods and assemble them into an ensemble:
Historical Story-Based Puzzle Simulator(Block-bootstrap Monte Carlo)
The rationale behind this method is that markets possess their own distinct "behavioral traits"—for instance, a continuous rally often breeds further upside, and downturns are typically accompanied by amplified volatility (fat tails). These unique traits leave permanent footprints within historical price segments.
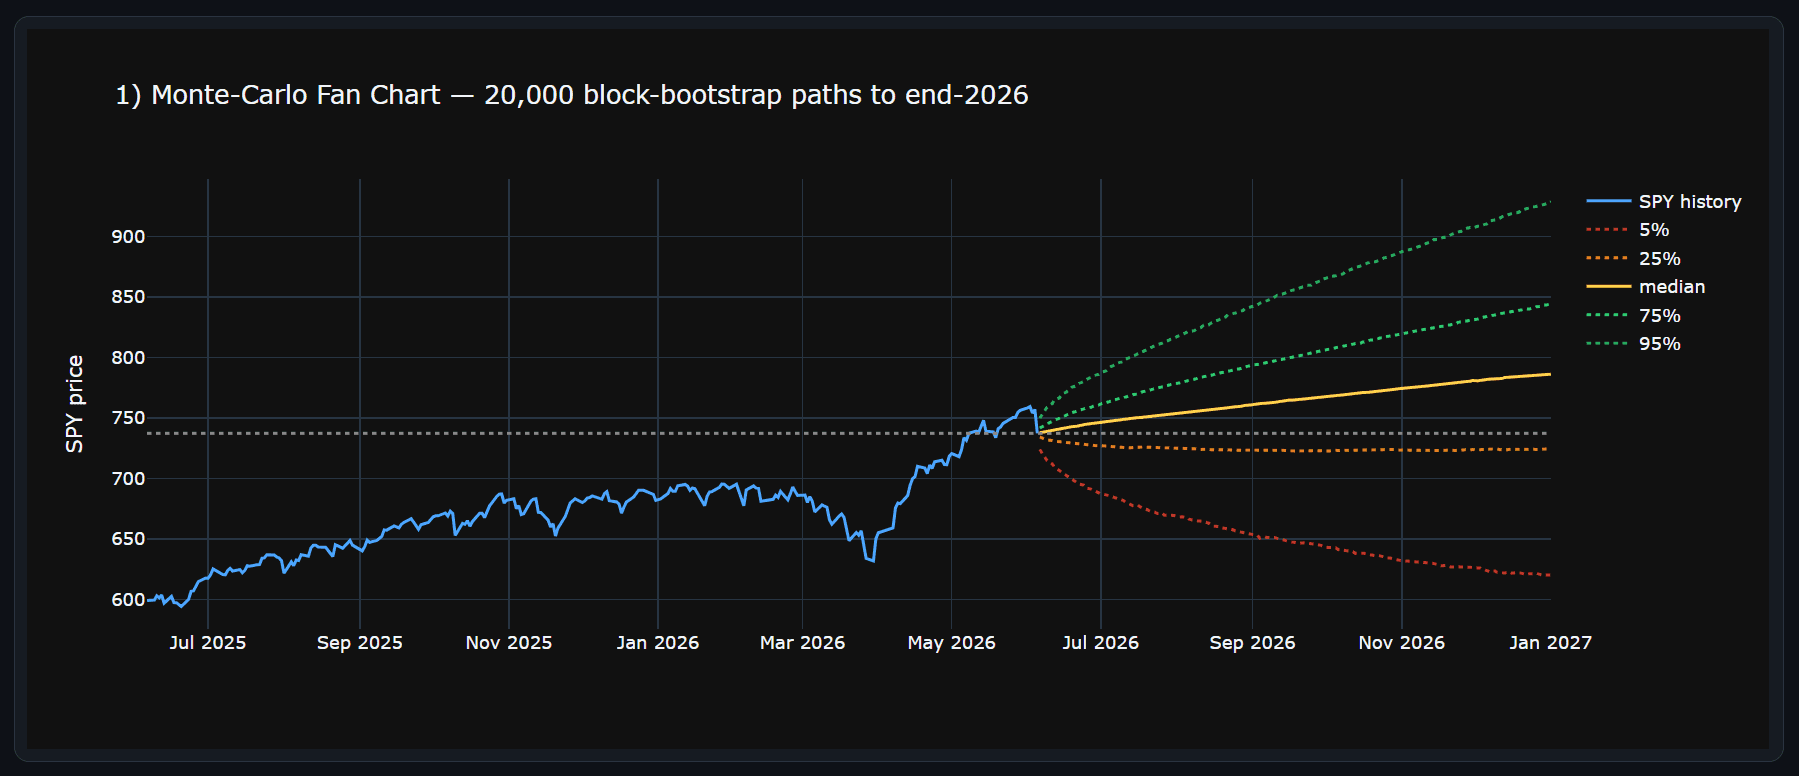
Rather than assuming that price returns adhere to a simplistic normal distribution, we slice the actual market movements of the past 20 years into continuous blocks (like jigsaw pieces). We then randomly resample and splice them together to construct tens of thousands of potential forward paths for the next 6 months.
Each simulated path faithfully preserves the market's inherent empirical memory and extreme volatility characteristics.
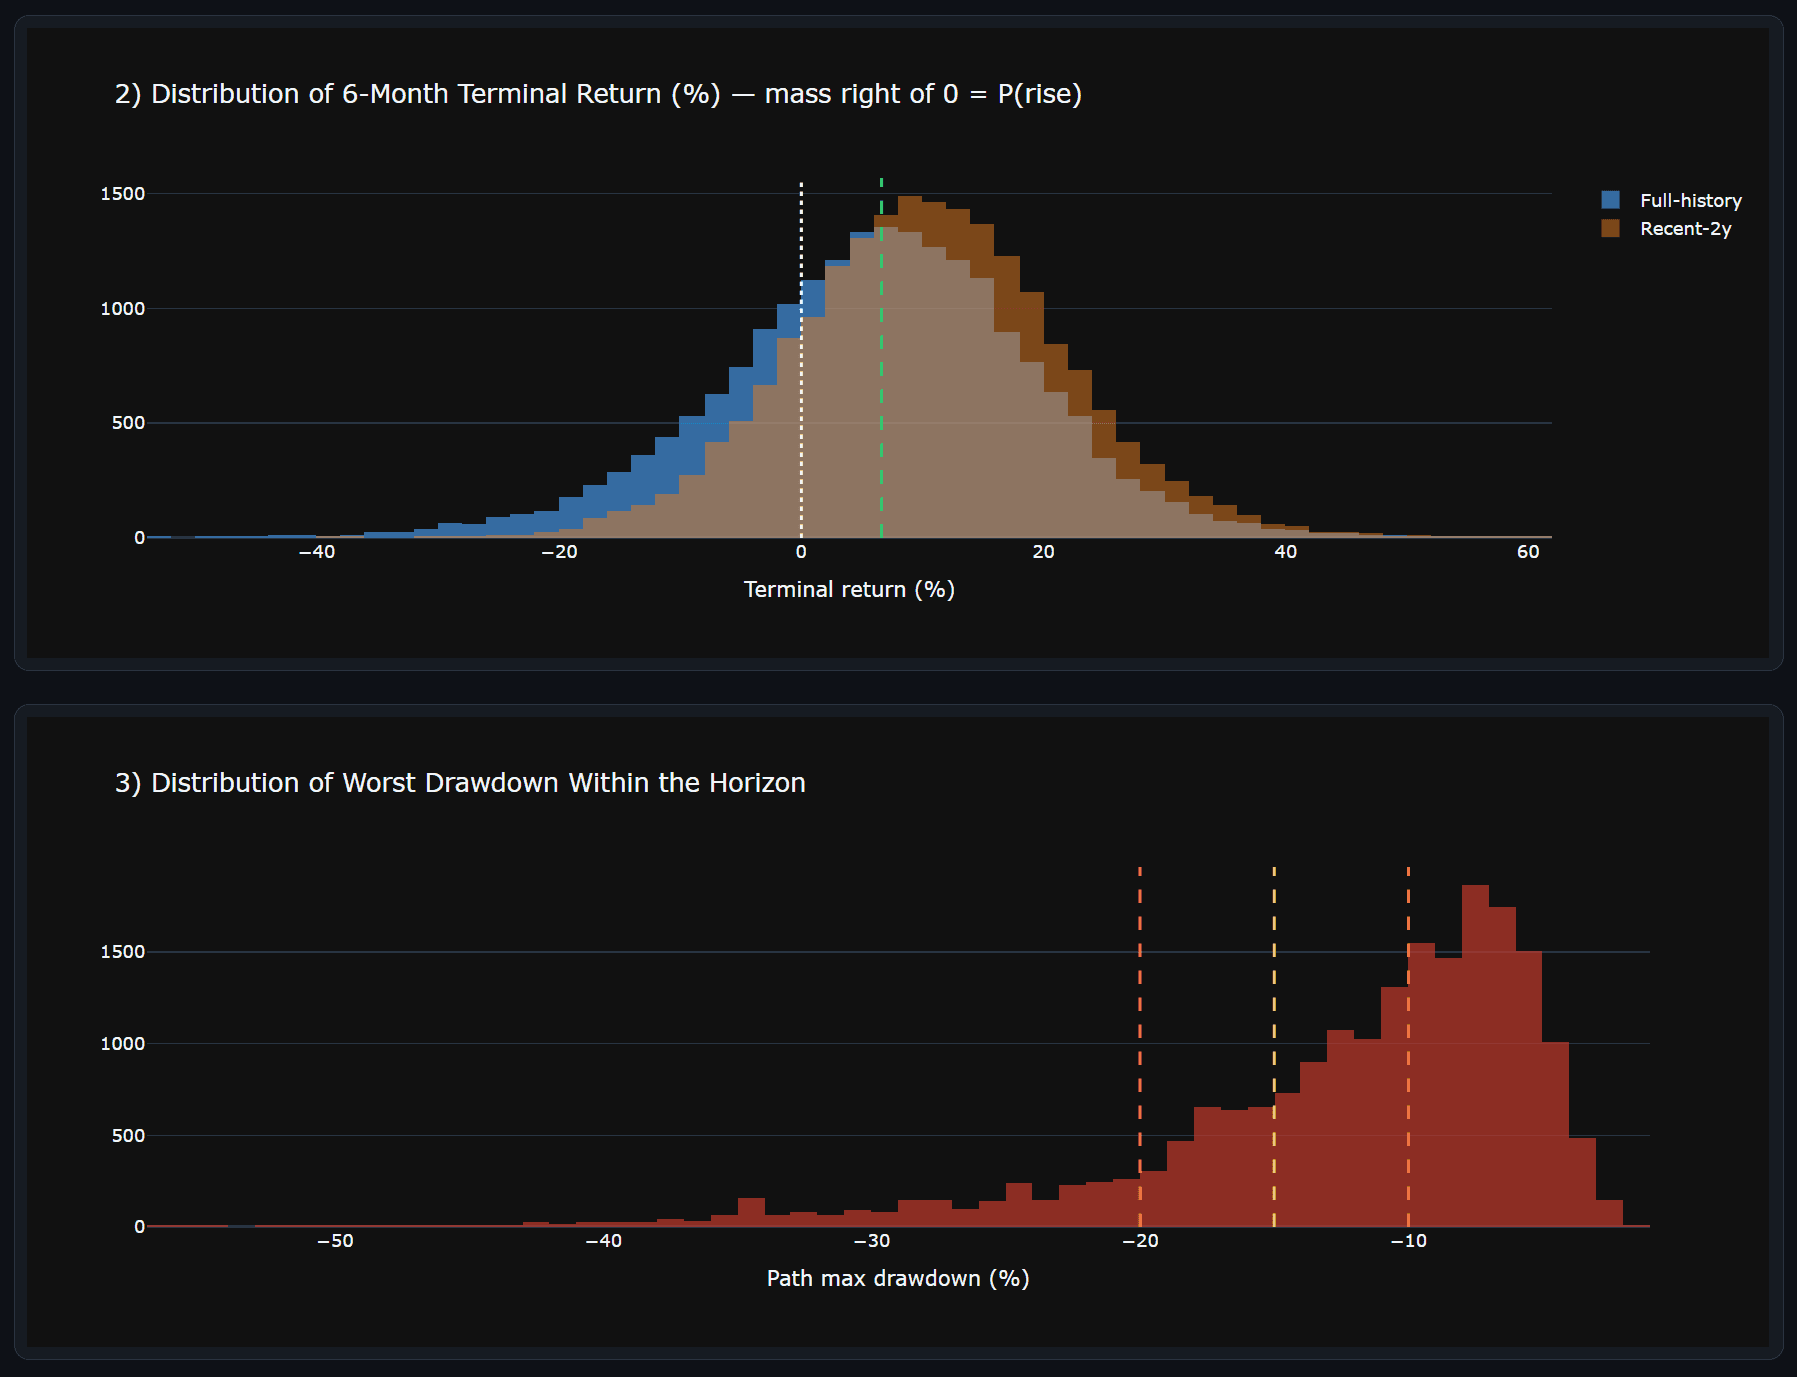
Finally, we perform a statistical analysis across all these simulated paths to determine what percentage end up higher than the current level and how severe the maximum potential drawdowns could be.
The advantage of this non-parametric approach is that it does not rely on rigid mathematical formulas; instead, it allows history itself to demonstrate how a market with such structural features is statistically likely to unfold.
A Shared Sense of Position: How Did History Play Out? (Conditional Phase Analog Approach)
Recall from our cyclical health check that the macro cycle spans roughly 1.2 years, and our current "position" happens to be exactly halfway up from the trough, climbing steadily at a $$90^{\circ$$ phase.
We combed through historical data to isolate every single moment that shared this identical "sense of position"—times when the cycle had just cleared its floor and was actively heading toward the peak. In total, we identified 555 such historical starting lines.
We then tracked the actual market performance strictly over the 6-month horizons following these similar starting lines, calculating their subsequent win rates and average returns.
This is equivalent to saying: "My current state of being has appeared many times in history; what happened to them most of the time afterward?" This is an analog methodology that shows deep respect for empirical market rhythms.
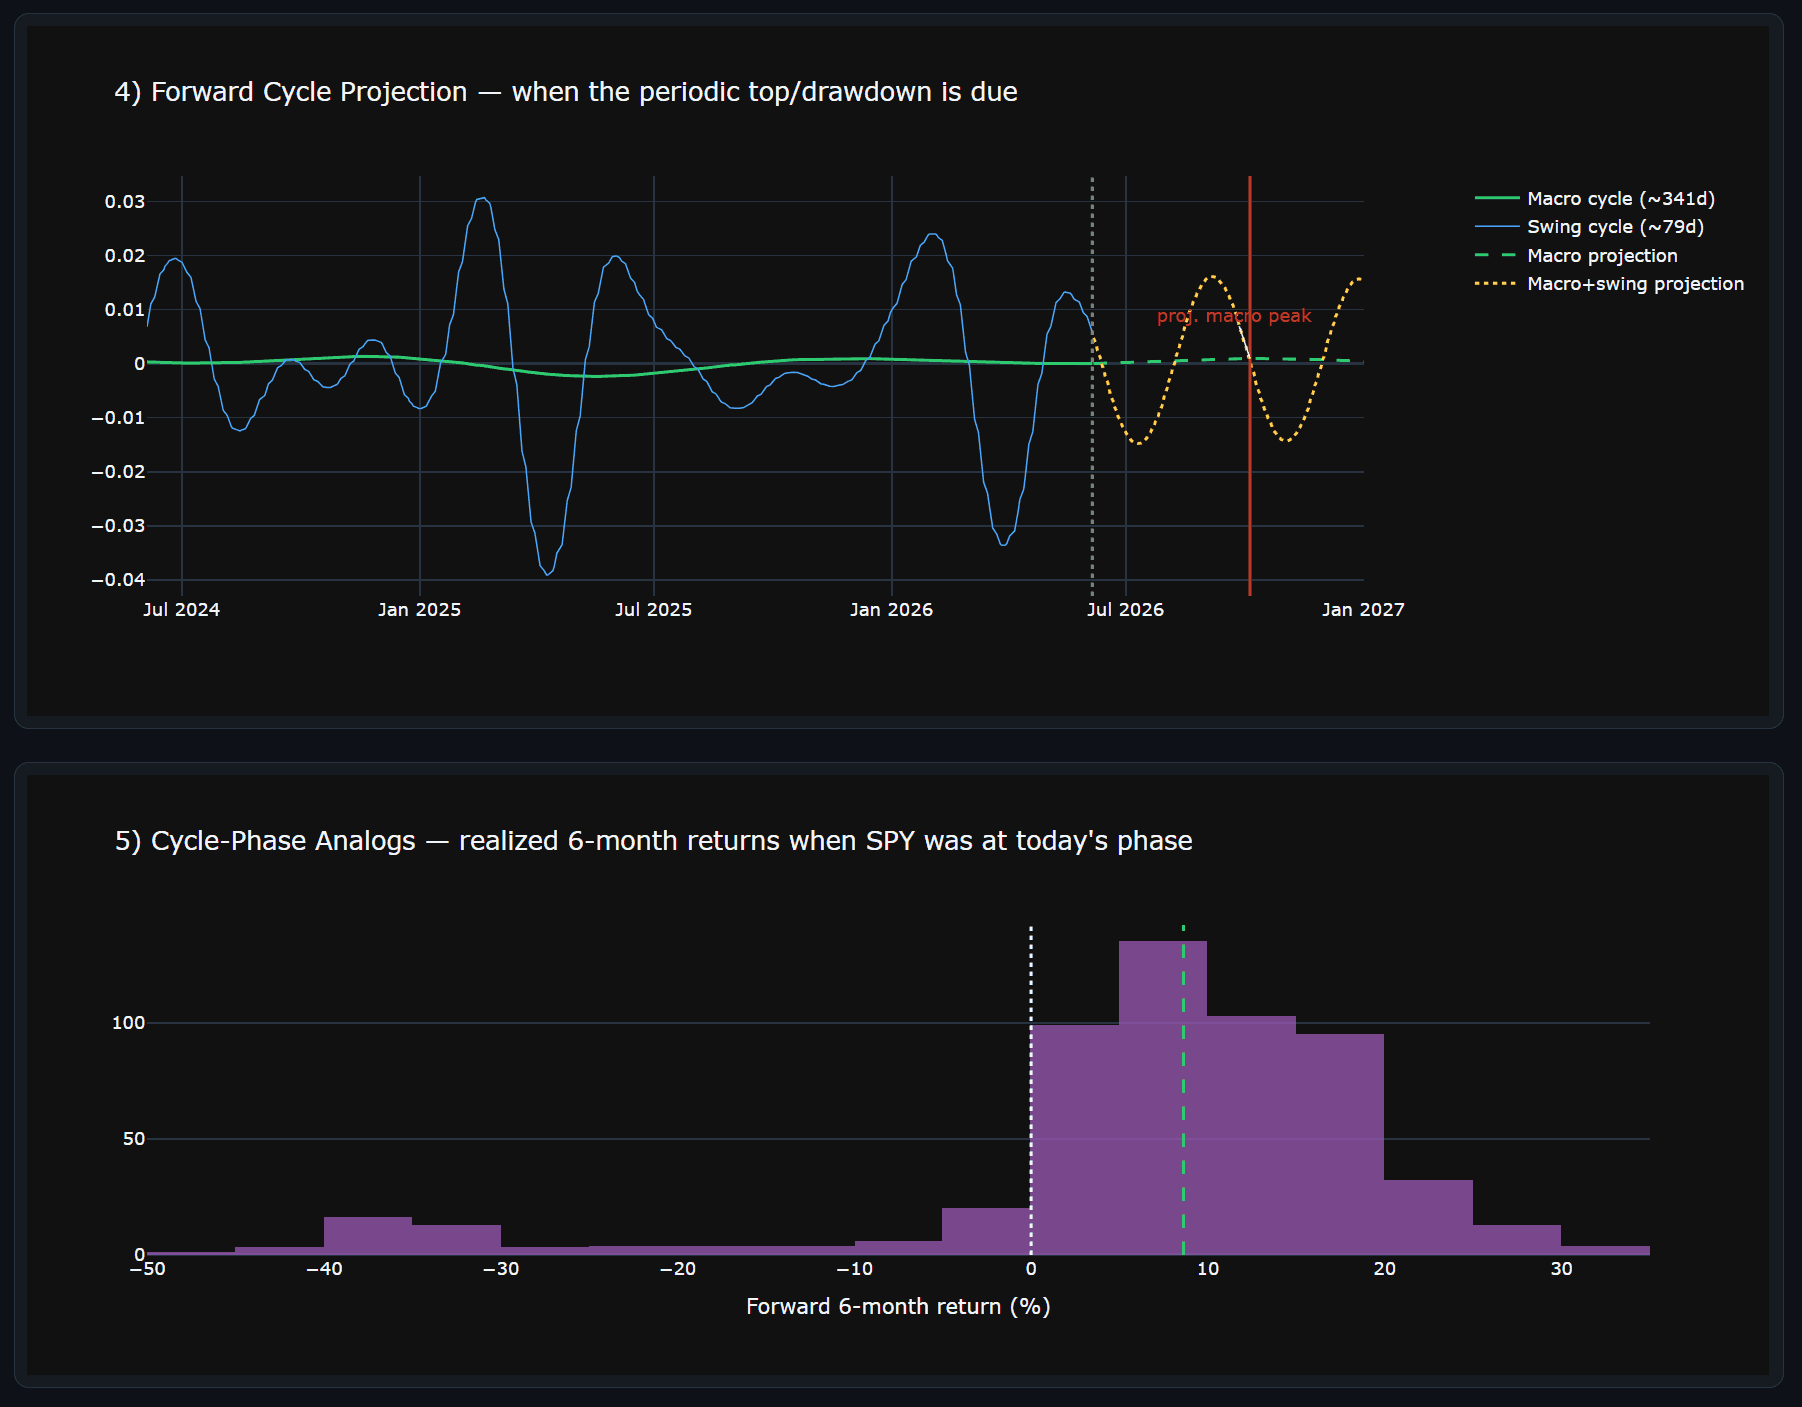
Mapping Out Future Rhythms: Forward Cycle Projection
Based on the dominant cycle length verified in our health check (approximately 309 trading days) and its current upward trajectory, we can directly map out the future morphology of this cycle—much like plotting a pure sine wave.
This allows us to roughly delineate when the next cyclical high is likely to manifest, and whether any cyclical troughs fall within the entire 6-month forecasting window.
Note that this is not a point-precise price prediction; rather, it forecasts the temporal framework of cyclical peaks and troughs, alerting us to the windows wherein tactical pullbacks are most statistically likely to occur.
During the computational pipeline, we actually revised our steps twice due to ambiguous directional signals. We only finalized the subsequent temporal calibrations after strictly aligning with the health check’s explicit verdict: "The macro cycle is in a $$90^{\circ$$ climbing phase with an upward vector."
This rigorous "attention to detail" ensures our conclusions remain mathematically coherent, self-consistent, and firmly grounded.
What exactly are the next 6 months going to look like? Answers to two core questions
Combining the above three rehearsals, we got a quite condensed probability answer sheet.
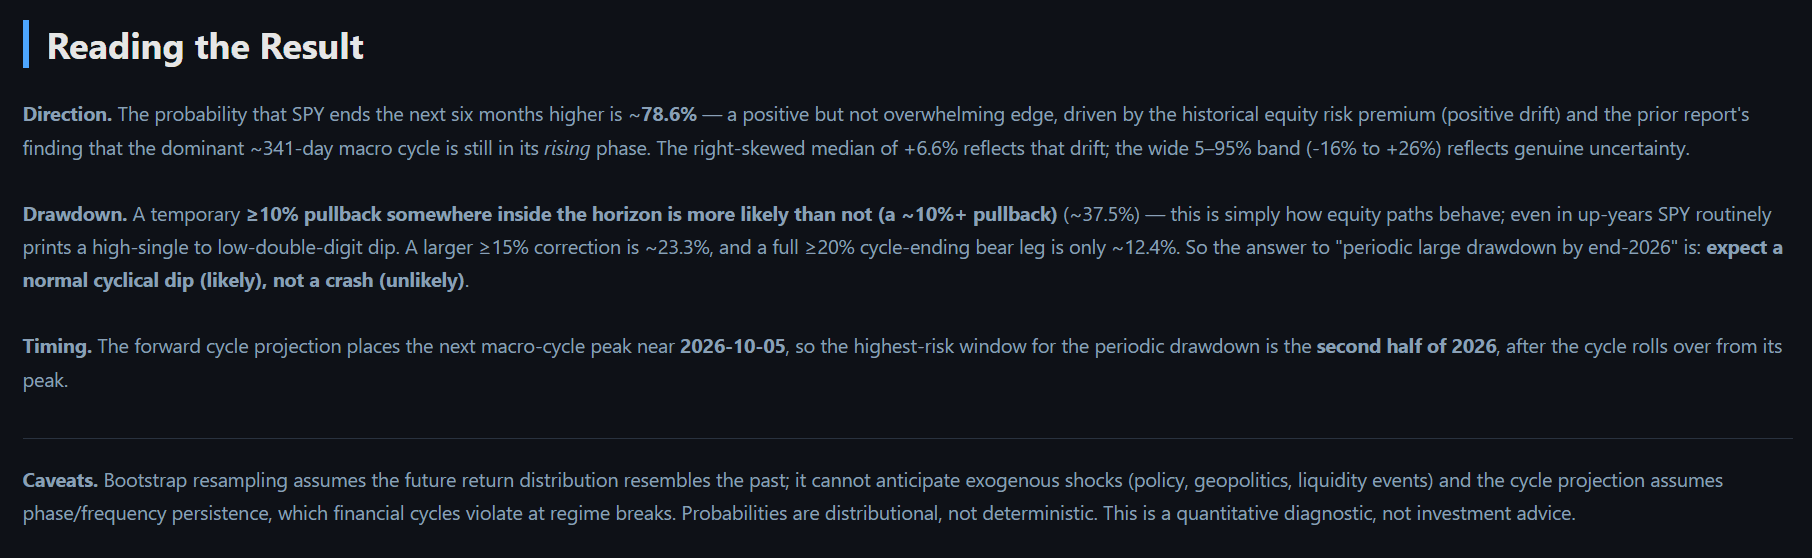
Q1: What is the probability of SPY being higher in 6 months?
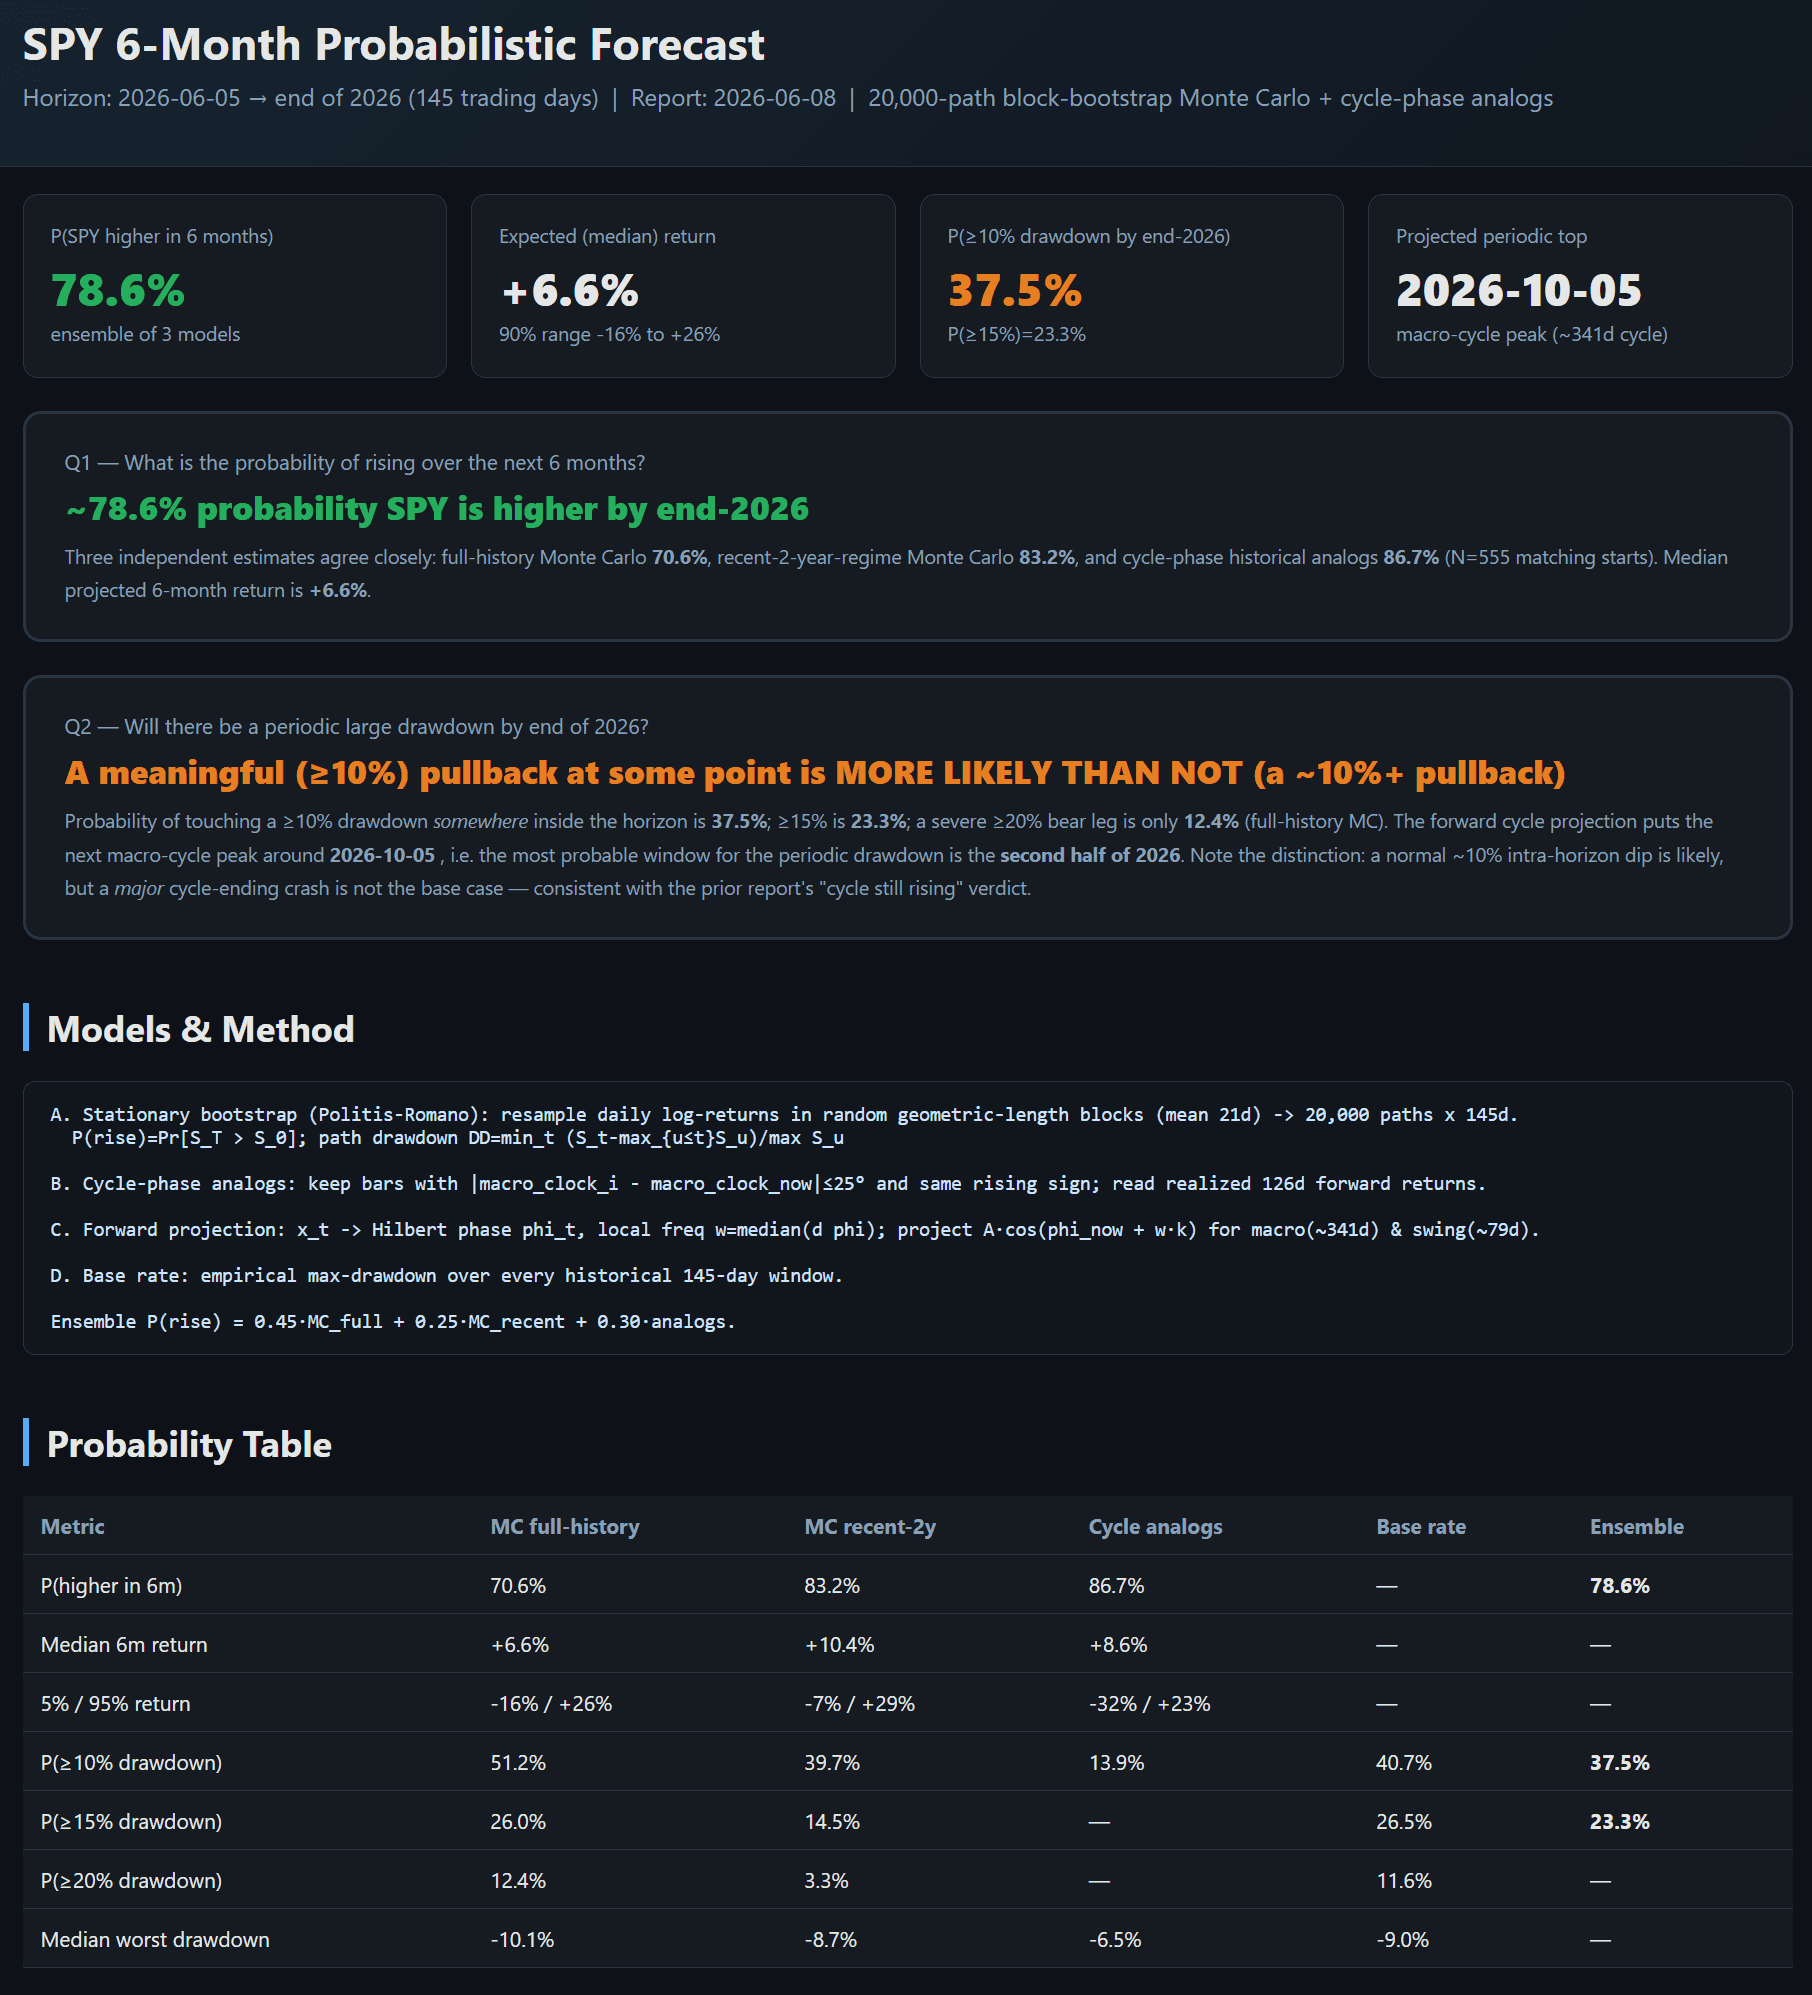
Answer: About 78.6% ensemble probability.
The three independent models show a high degree of directional consensus.
The full-history Monte Carlo shows 70.6% (median +6.6%), the recent 2-year regime shows 83.2% (median +10.4%), and historical cycle analogs show 86.7% (median +8.6%).
The 90% range of outcomes falls between -12% and +27%.
The positive skew is intuitive: equities carry a natural positive drift, and the macro cycle is actively pushing upward, providing a distinct tailwind.
Q2: Will there be a major, catastrophic crash by the end of 2026?
Answer: A normal tactical pullback is likely, but a cycle-ending crash is NOT the base case.
The probability of experiencing a standard tactical drawdown of ≥10% is approximately 38% (with some models shifting as high as 51%). While this sounds significant, it is entirely normal behavior. Even during exceptionally strong years, an intra-year dip of around 10% is routine—it represents a mere "pothole on the road" rather than the final destination.
The probability of a sharper, more defined correction of ≥15% stands at approximately 23%.
The probability of a severe, true bear-market-level decline of ≥20% is only around 12%, making it far from the baseline scenario.
Therefore, the conclusion is distinct: while one must be mentally prepared for routine turbulence, a cycle-ending catastrophic crash is simply not our current base case.
More importantly, consider the timing window. Forward projections position the next peak of this macro cycle around early October 2026 (~84 trading days away). Crucially, no cyclical macro troughs manifest within the entire 6-month forecasting horizon.
This implies that the primary risk of a cyclical rollover is not immediate; instead, it is heavily concentrated from Q4 2026 through early 2027, occurring only after the peak has cleared and the cycle transitions into its downhill phase.
Connecting the Pieces
This forward-looking rehearsal is entirely self-consistent with our prior cyclical health check:
The market's macro cycle is still actively climbing, suggesting a high probability of a structural grind upward toward a tactical high in the autumn. Only after that milestone is passed will a cyclical retrenchment become the dominant risk. The current equity rally is not an exhausted, late-stage spike ("the end of a powerful arrow's flight"); rather, it represents a measured, statistically supported journey halfway through its course.


