Search All
Structured Trading Systems: Defining Trends via MACD and Momentum Analysis


Success in financial trading lies not in predicting the future, but in identifying market structure and executing high-probability strategies. This article provides an in-depth breakdown of the "Three-Step Observation Method"—a system based on moving averages, MACD, and momentum analysis—designed to help traders establish a standardized, rule-based process and transition from emotional trading to rational execution.
In financial trading, the key to success is not predicting the future, but identifying market structure and executing when statistical advantages emerge. This article breaks down a system based on market momentum and data analytics, designed to help traders build a standardized decision-making process.
The Logical Framework: Beyond Reactive Trading
Most traders face losses due to reactive, emotional trading. Chasing prices during volatility is a common trap. Trading is fundamentally a game of probability and structure. To achieve consistent returns, one must transition from a reactive trader to a disciplined executor. Establishing a rule-based framework is the only path from amateur to professional.
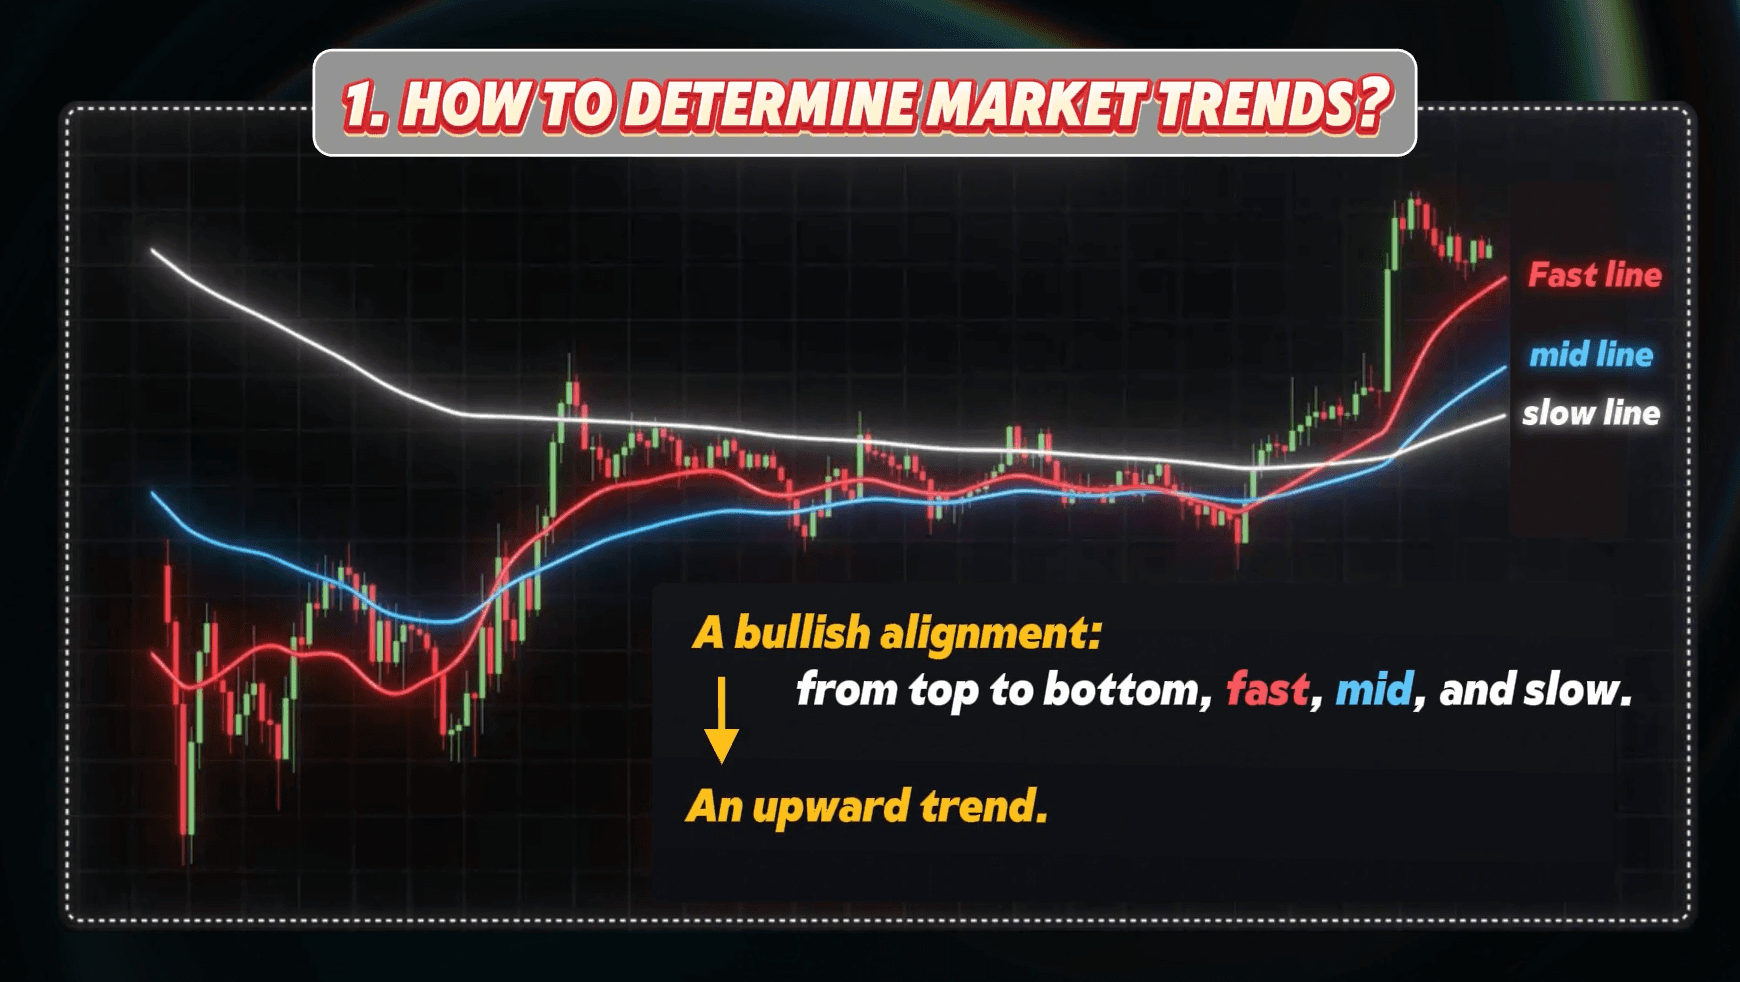
Step 1: Locking in Trend Origins with MAs and MACD
Moving Averages (MA) are foundational for defining market trends. When short, medium, and long-term MAs show a divergent alignment, the market rhythm becomes clear. To pinpoint entry timing, we use the "MACD Three-Step Method":
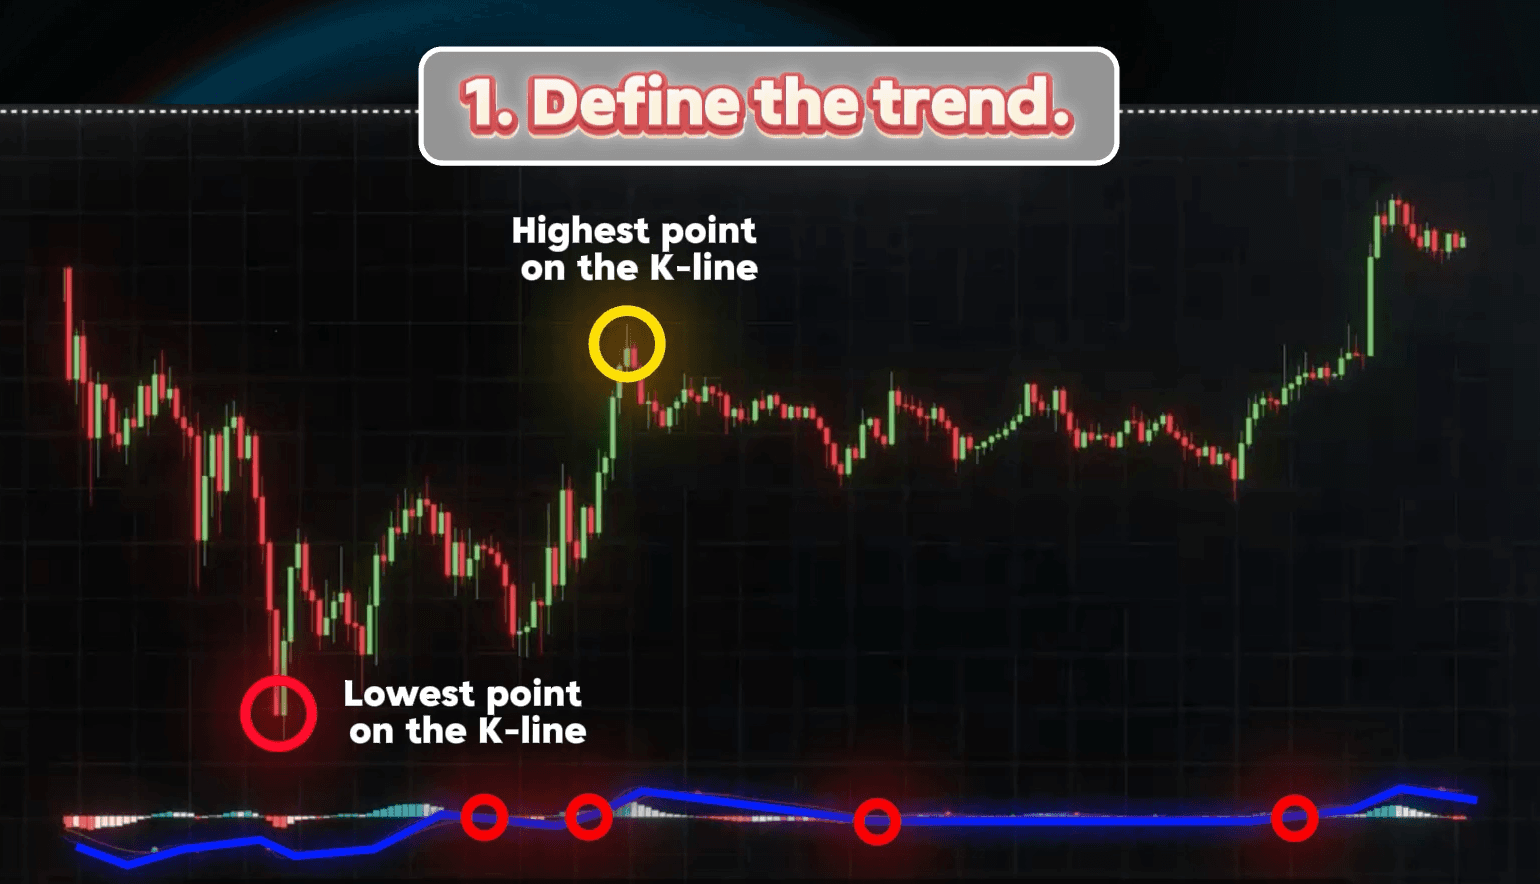
Defining Baselines: When the MACD is above the zero line, we lock in the lowest candle before the cross as our support baseline; if below, the highest candle acts as our resistance baseline.
Establishing Defenses: This baseline ensures we are positioned early in the trend rather than entering at the exhausted tail end. MAs provide direction, while the MACD provides the timing trigger.
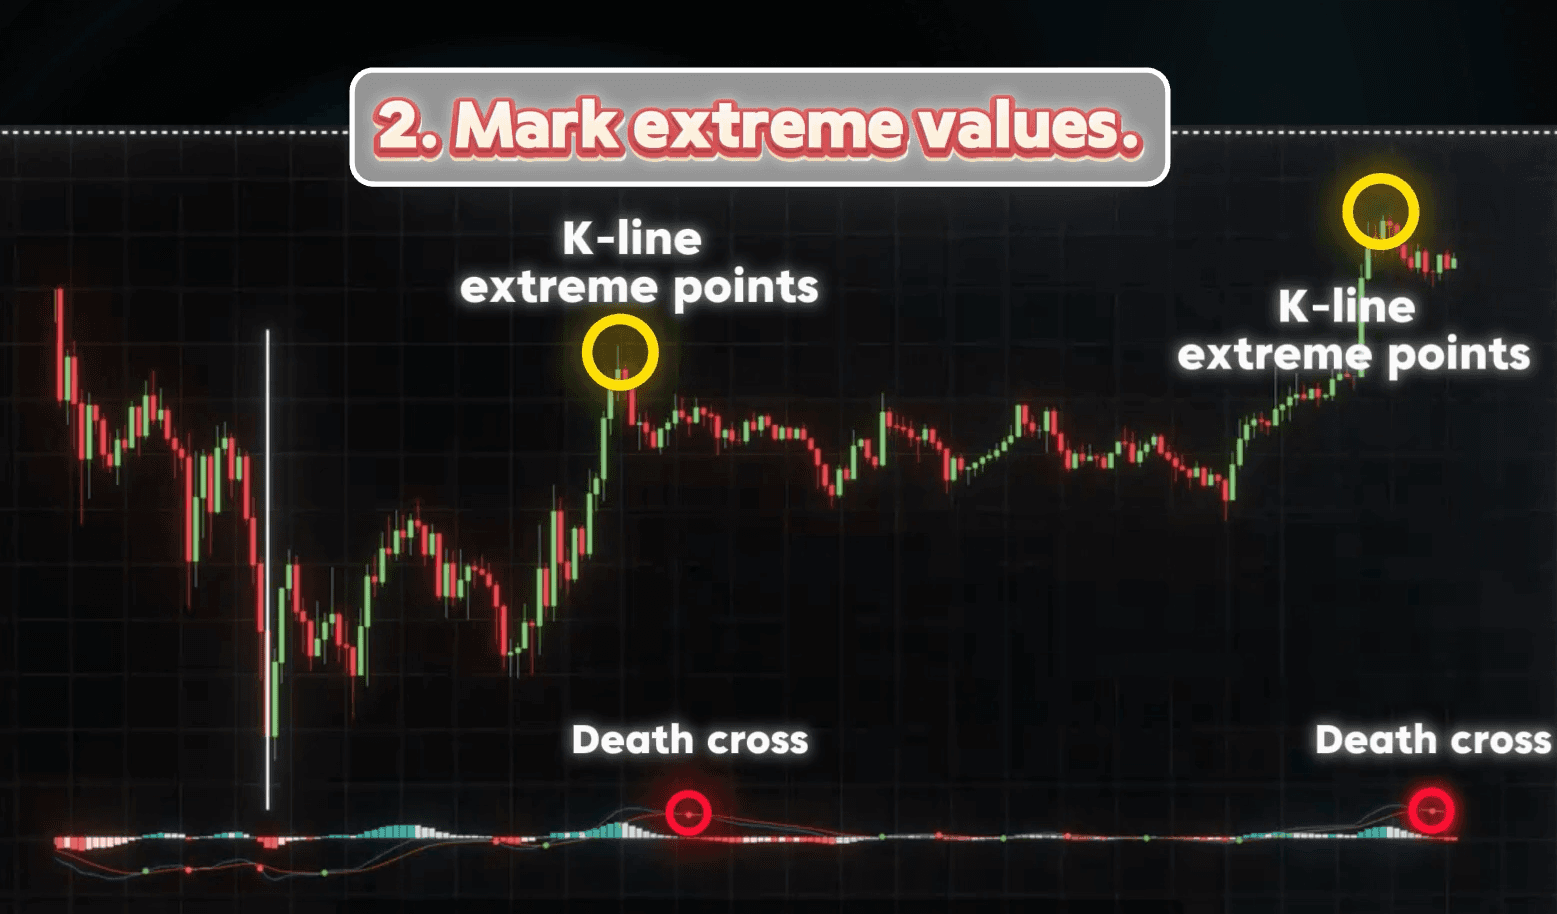
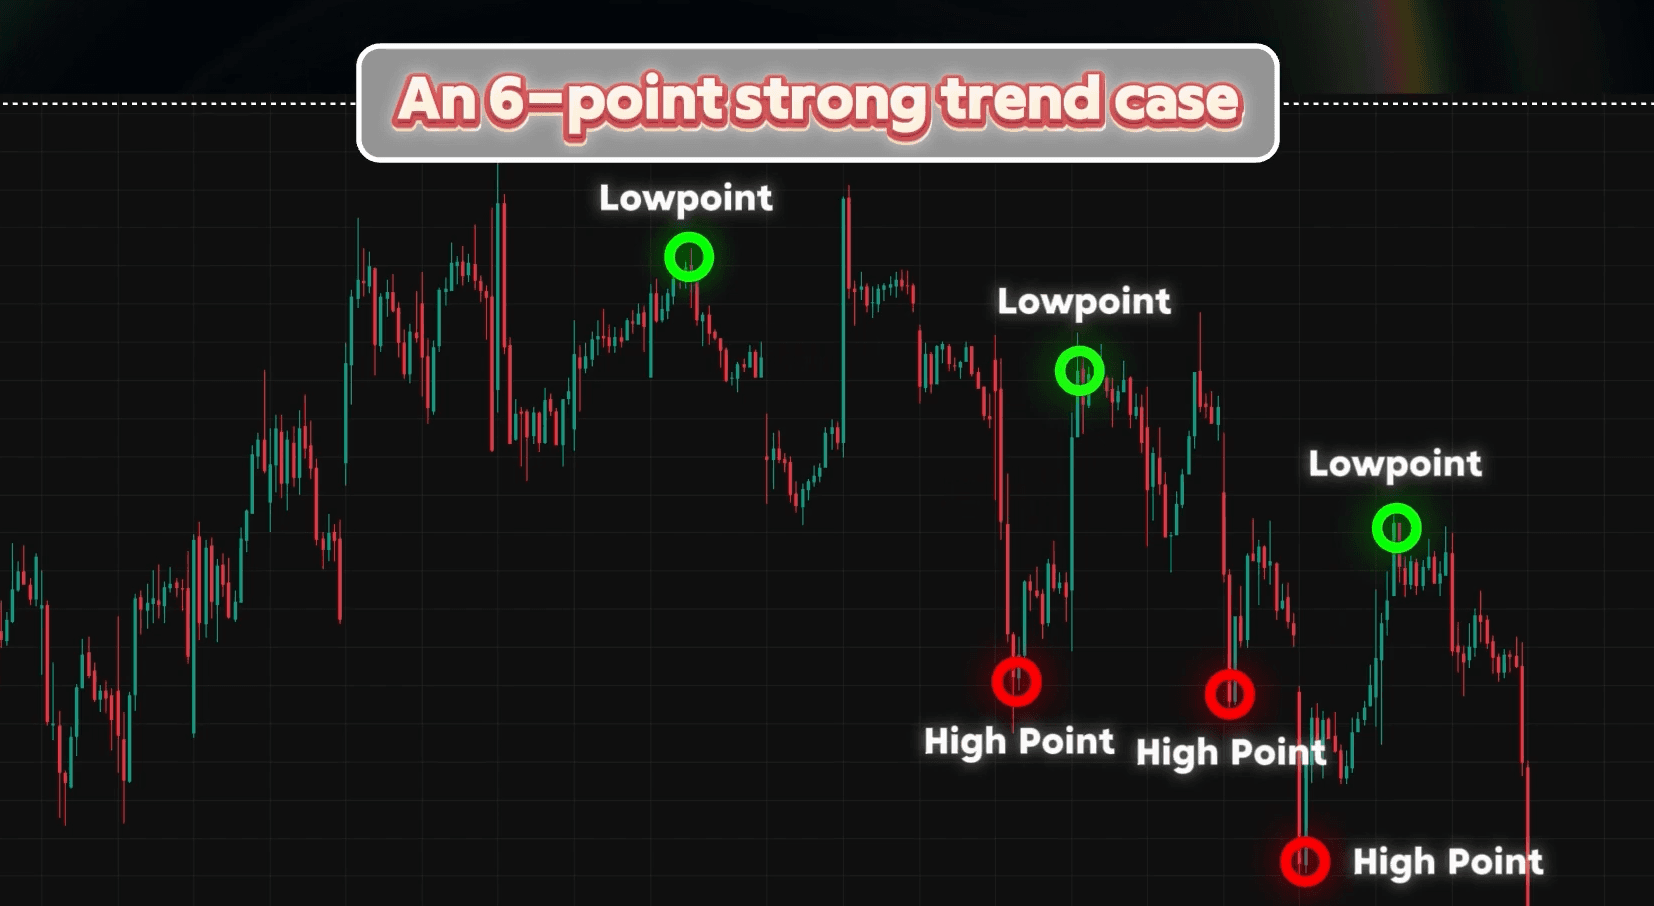
Step 2: Structural Review—Extremes and Divergence
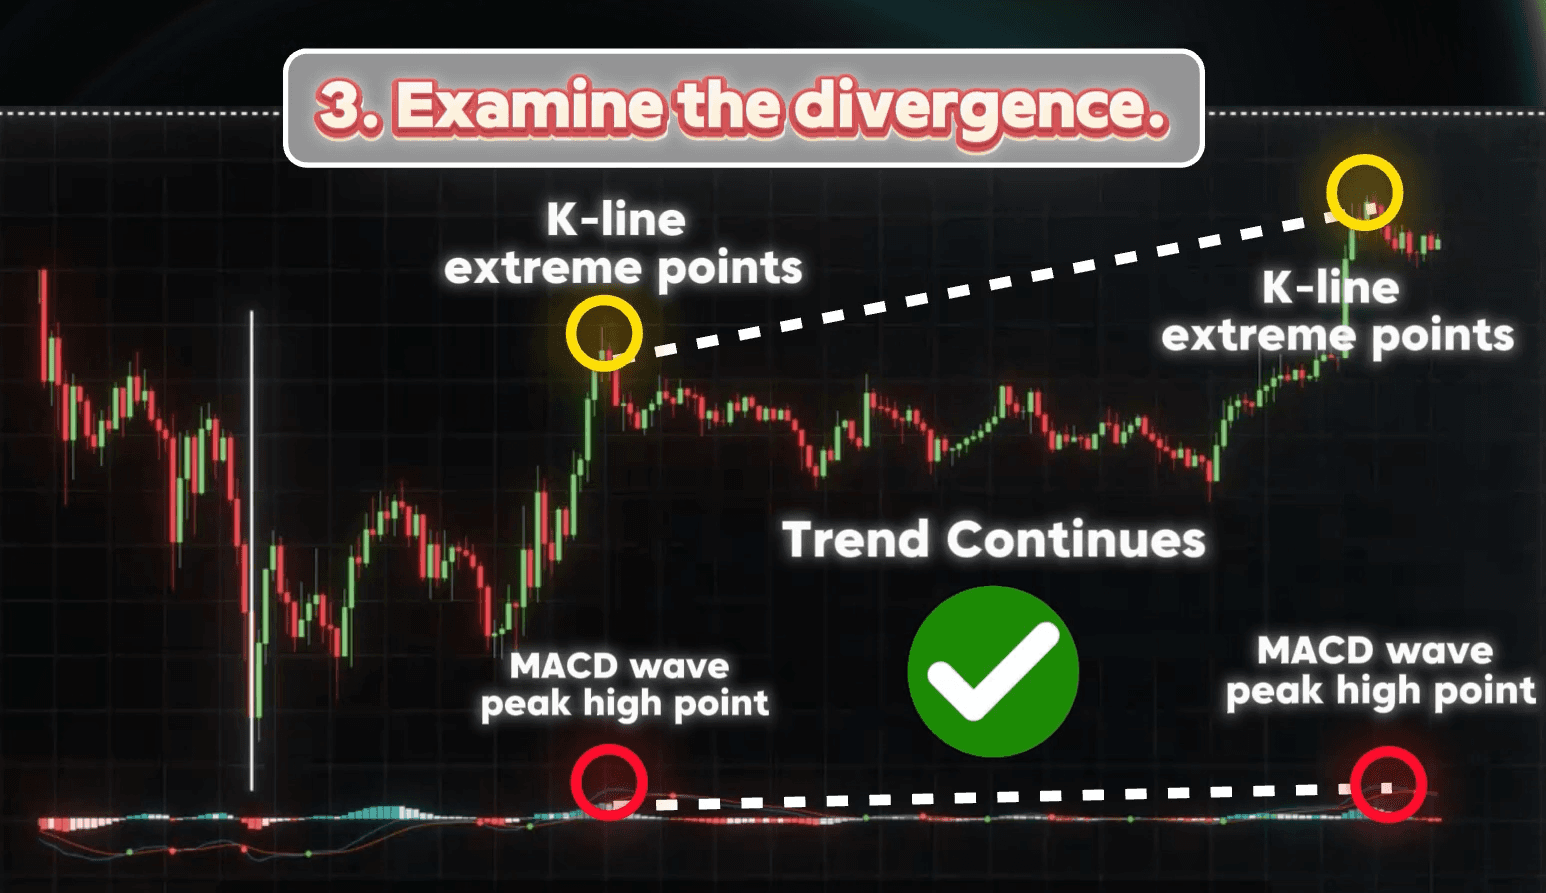
Marking extremes is core to validating structural integrity. In an uptrend, focus on the MACD peaks above the zero line and map them to corresponding price highs.
Divergence Identification: Connect MACD peaks with price highs. If both trend upward, buying momentum is strong. If price makes a new high but MACD fails to follow, a bearish divergence exists, indicating momentum decay.
Risk Defense: Recognizing trend fatigue allows you to filter out high-risk trades at structural exhaustion points.
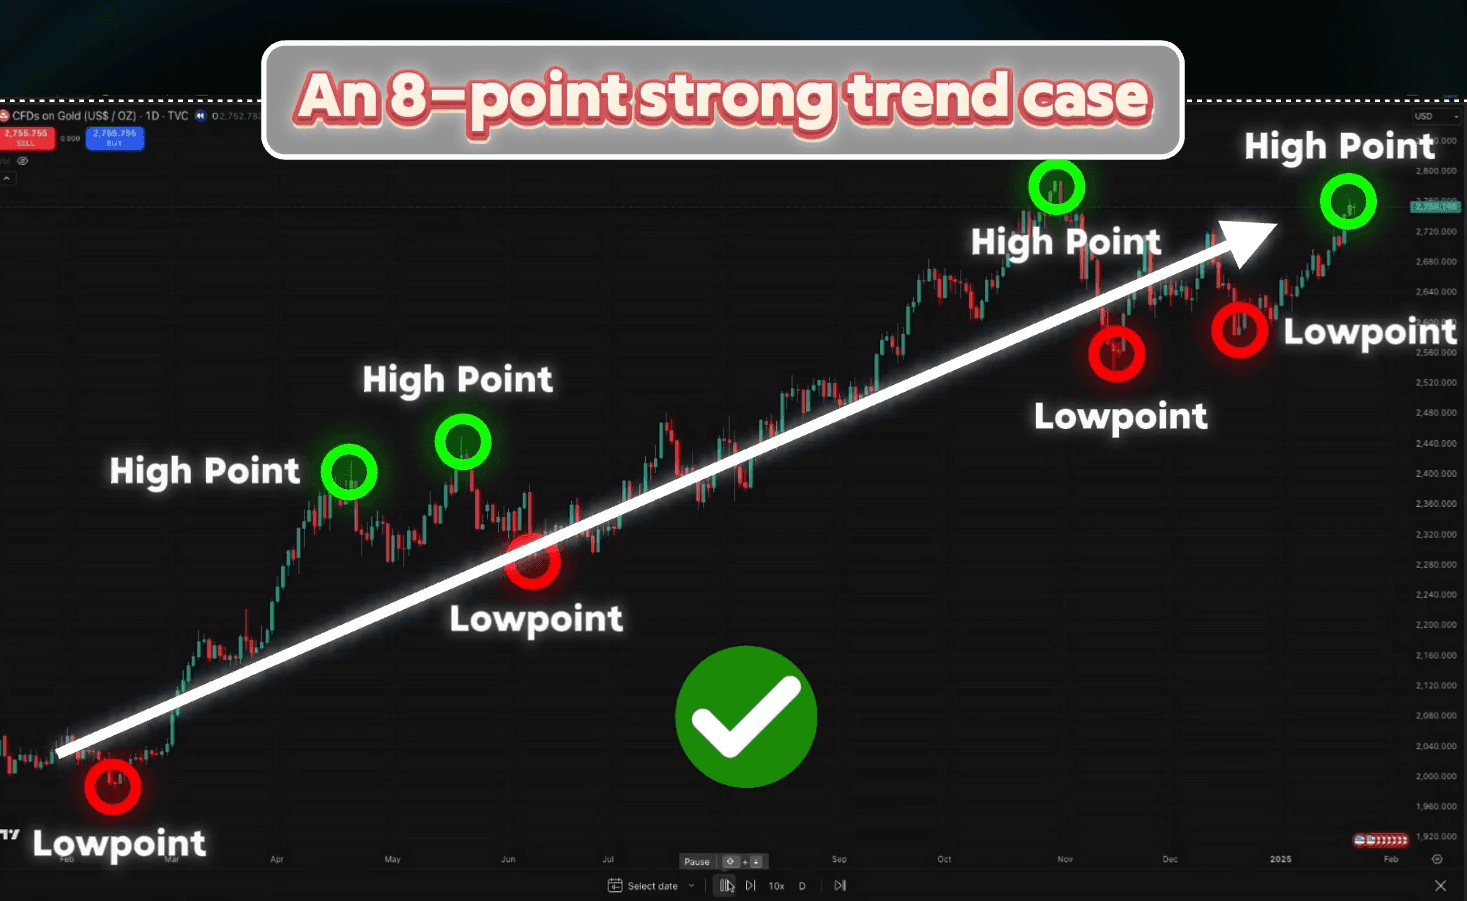
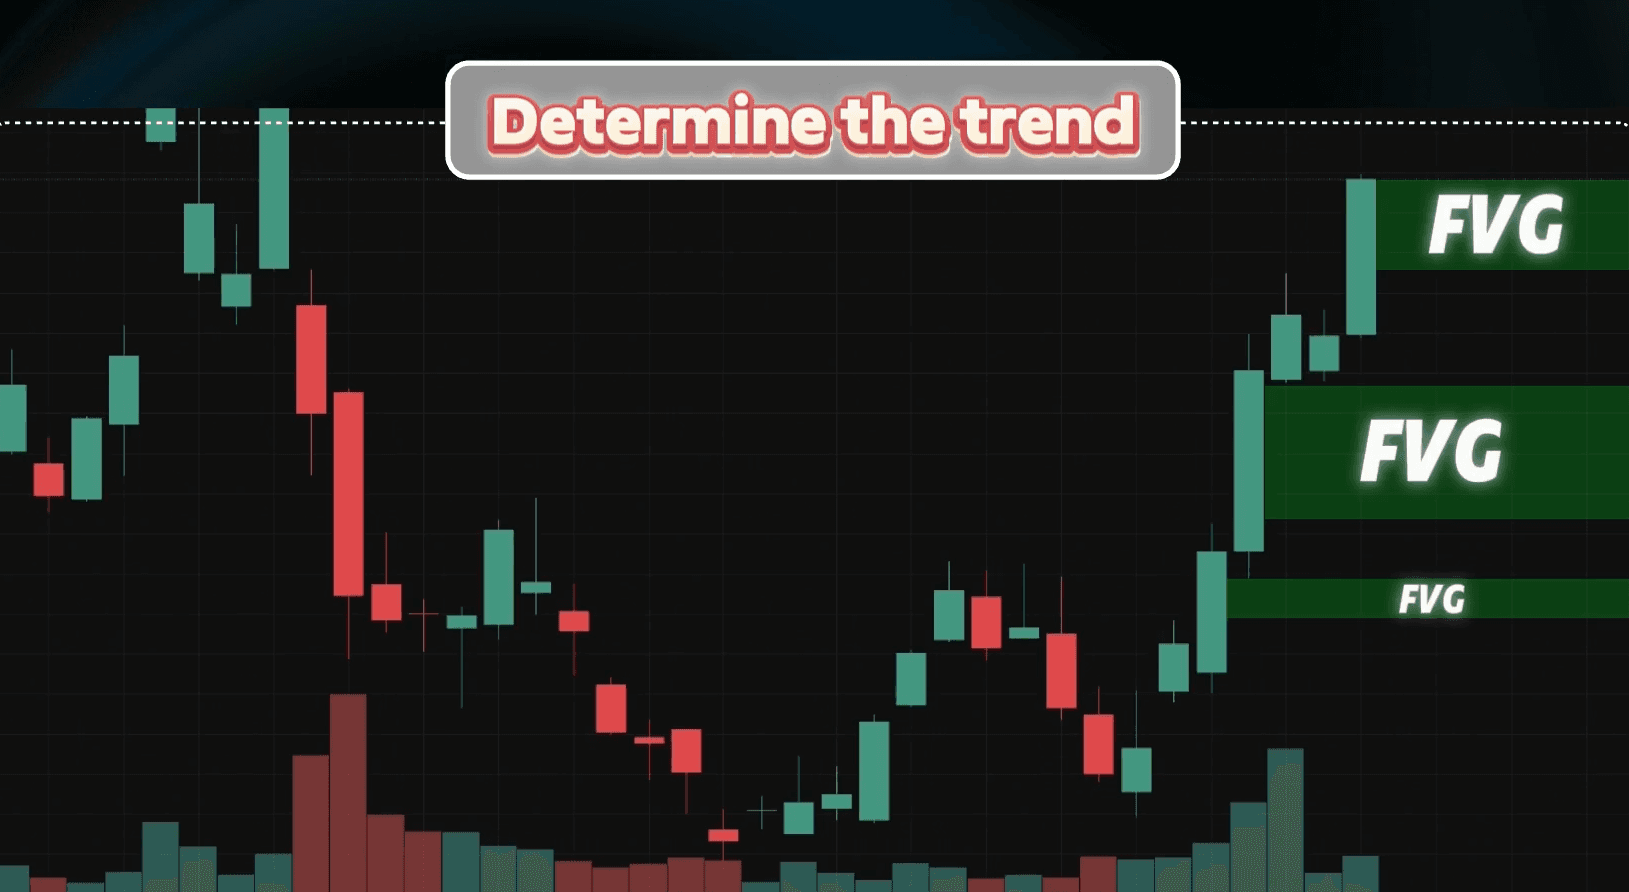
Step 3: Momentum Analysis—Strong Trends vs. False Breakouts
The line between a strong trend and an invalid breakout is hidden in momentum details.
Strong Trend Characteristics: High-quality trends feature dominant trend candles with shallow pullbacks and "fresh Fair Value Gaps (FVG)," signaling strong demand at higher levels.
The Weak Breakout Trap: If a trend looks bullish but breakouts lack follow-through and FVGs are frequently filled, the move is likely a false breakout. Learning to distinguish these nuances saves traders from over 80% of market traps.
Risk Management: Building a Profitability Model
Systematic trading prioritizes Reward-to-Risk ratios over individual trade win rates.
Execution Logic: Enter positions only when larger timeframe trends are clear, MACD divergence is absent, and FVG momentum confirms the move.
Risk Control: Strictly adhere to stop-loss levels, capping per-trade risk to a disciplined percentage (e.g., 1-2%).
Discipline: Success comes from executing when structural rules are met, not from predicting outcomes. Long-term stability is the result of consistent execution.
Conclusion: Finding Market Advantages Through Data
By combining larger timeframe MACD confirmation with current energy structures, traders can operate effectively in high-probability zones. Consistent profit is the byproduct of a standardized execution system.
Thank you for your subscription and support. We will continue to share in-depth market analysis and practical trading tutorials. Stay tuned for our upcoming professional updates.