First
Last
email@email.com
The Fibonacci Rhythm: Deconstructing the Market's "Breath" and Code
Strategy
June 5, 2026


Skye
Decoding institutional Liquidity Sweeps
Abstract:
Trading is not chaotic disorder, but rather a rhythmic movement governed by inherent principles. This article provides a comprehensive analysis of the Fibonacci Sequence and the Golden Ratio in financial markets, teaching you how to use these key levels to identify the market's "rhythm" and precisely capture the next major turning point.
Do you think Mona Lisa's smile is merely a matter of art? Wrong. Behind it lies the Golden Ratio. In financial markets, this same ratio represents the market's "breath." The Fibonacci Sequence (0, 1, 1, 2, 3, 5, 8…) is far more than elementary school mathematics—it is the underlying rhythm hidden beneath market movements.

Why is Fibonacci so effective in trading?
Financial markets are not completely random; they exhibit collective behavioral patterns. Fibonacci tools transform market fluctuations into visual support and resistance levels through these mathematical sequences. From a behavioral finance perspective, the effectiveness of Fibonacci levels has a "self-fulfilling prophecy" characteristic—when enough traders simultaneously focus on key levels like 61.8% or 38.2%, these levels naturally attract buying and selling interest, forming genuine support and resistance zones.
Execution Strategy: Marking the Market's "Rhythm"
To translate this mathematical model into a practical trading framework, follow these steps:
• Select Key Points: Identify a clear swing high and swing low. These two points form the foundation for drawing Fibonacci retracement levels.
• Draw the Tool: Align the first line of the Fibonacci retracement tool with the high point and the second line with the low point.
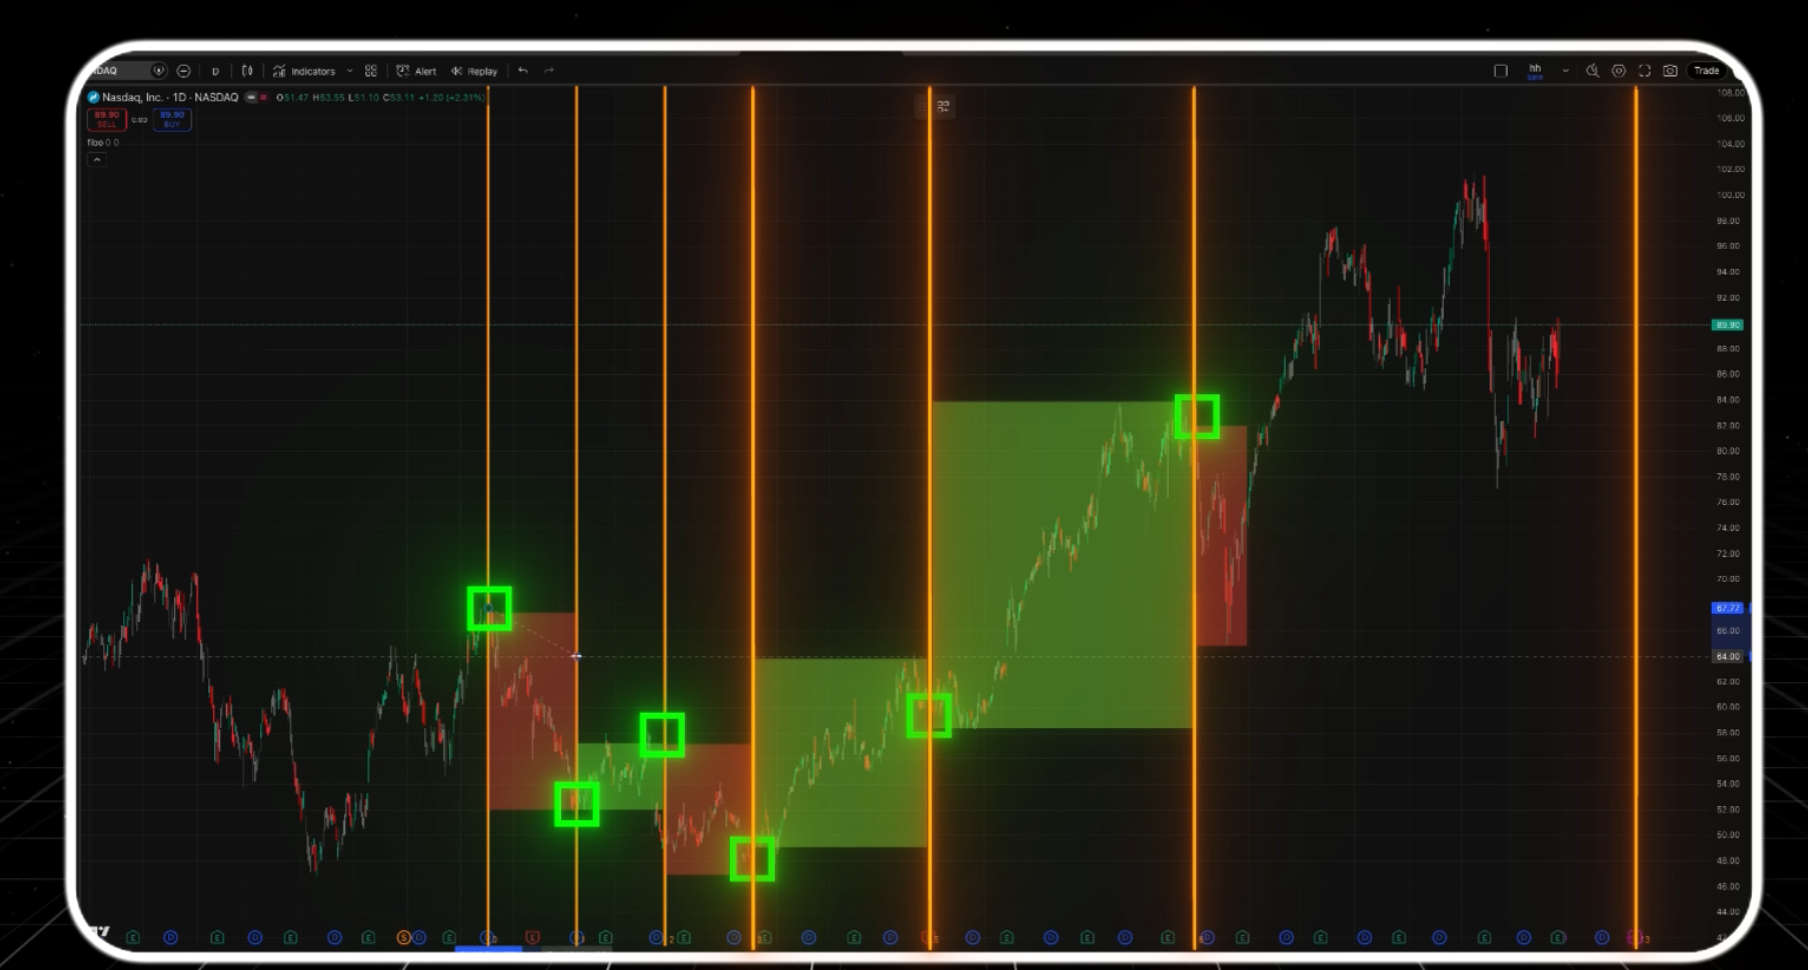
• Interpret Turning Points: Something remarkable then occurs—the Fibonacci lines automatically highlight potential future market turning points. Regardless of the timeframe, these levels consistently hold significant reference value in market rhythm.
Trading Application: Synchronizing with the Market
Market fluctuations are like a song, where the alternation between high and low notes is the rhythm. Fibonacci lines are the "drumbeats" of that rhythm.
- Capturing the Rhythm: When price retraces to key Fibonacci levels, it often corresponds to intermediate bottoms or tops. For example, in a strong uptrend, when price retraces to the 61.8% golden retracement level and demonstrates clear buying support, this often represents an optimal opportunity for bulls to re-enter. Conversely, in a downtrend, when price rebounds to the 61.8% level, it may serve as an ideal setup for short positioning.
- Time-Price Resonance: Beyond price retracements, Fibonacci can also be applied to time analysis. The Fibonacci Time Zone tool applies the Fibonacci sequence to the time axis—starting from a significant high or low, it projects 1, 2, 3, 5, 8, 13, 21, 34, 55… time units (candles) into the future.
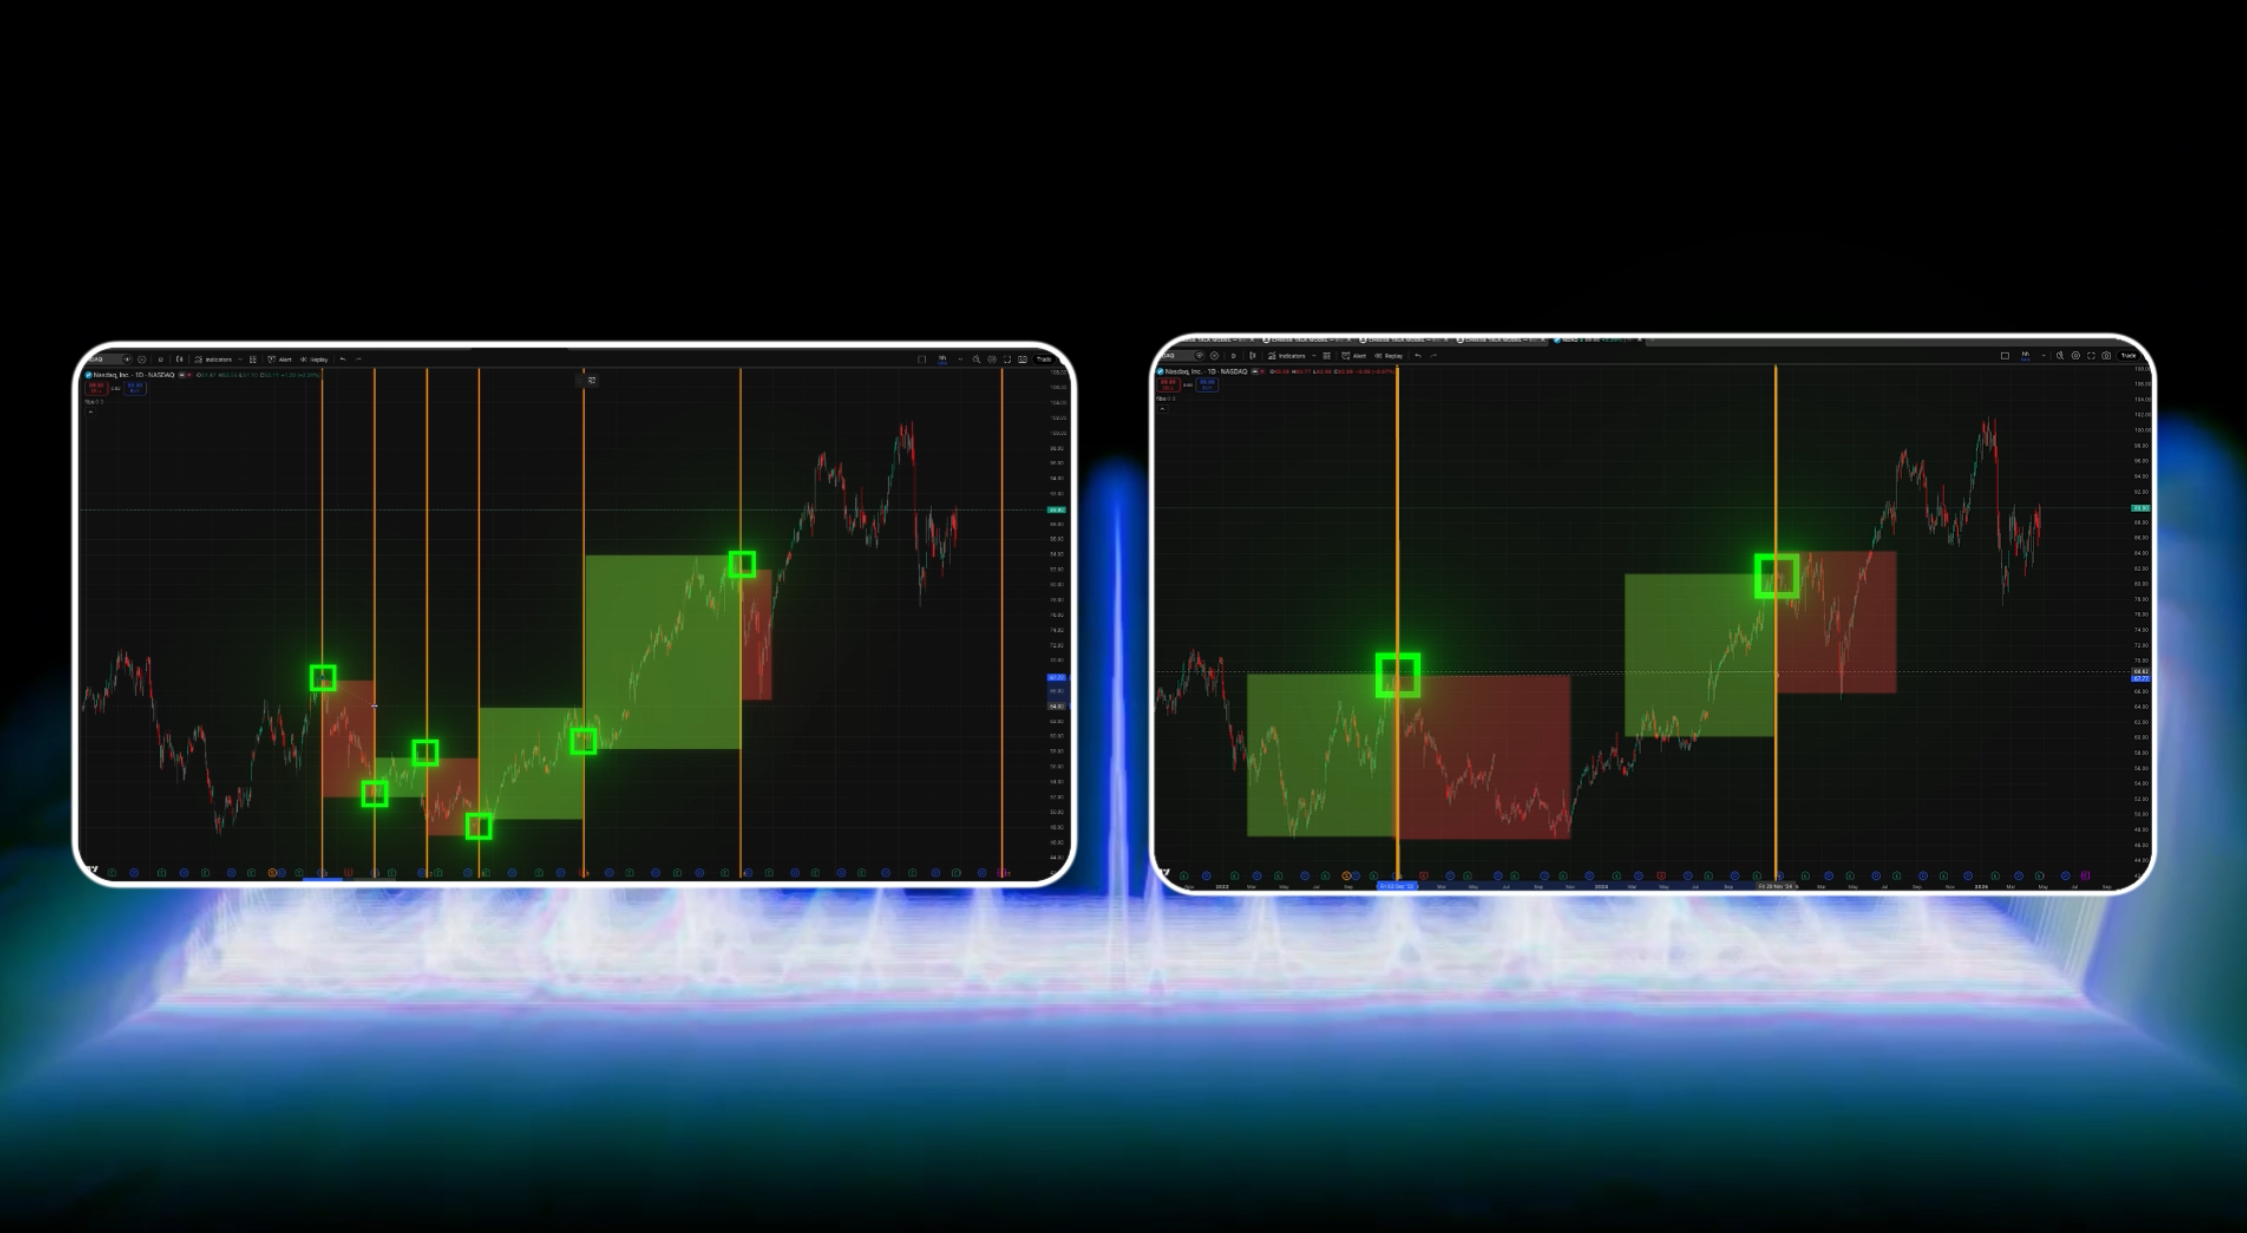
When these key Fibonacci time lines appear on the screen, they often signal that the next major move is approaching. Notably, when price simultaneously reaches both a Fibonacci price retracement level and a Fibonacci time zone, the convergence of these two dimensions significantly increases the reliability of the turning point.
Learn to observe these lines, and you will no longer be a follower of the market, but rather—like reading a codebook—anticipate the key turning points of trends.
Conclusion:
Fibonacci is not only a synthesis of mathematics and art, but also a reflection of market sentiment and capital flow. Master it, and you can synchronize with the market's rhythm, stepping to the correct beat before the next major rally or sell-off.
The essence of trading lies not in predicting the future, but in understanding the market's breath. When you grasp this "code," you will be able to respond to market fluctuations with greater composure and make the most precise decisions when key turning points emerge.
In an era of information overflow, alpha lies in asymmetric execution, not intuitive consensus.
Skye
SMC Market Analyst
Subscribe to our newsletter
Get the insider insights you need to scale, straight to your inbox.
Decode the Market. Quantify Your Edge.
Elite quantitative models and real-time execution signals. Trade with institutional power.

Copyright © 2026 Hong Kong Arakawa Limited. All rights reserved.


%2C%20Color%3DNegative.svg)