搜索
Momentum Trading: Mastering the "Structure + Momentum" Dual-Confirmation


If you find yourself being stopped out just points away from your profit target, it isn't just a streak of bad luck—it's a lack of momentum confirmation. Price action alone often triggers false signals in ranging markets. The core philosophy of this 5-minute momentum strategy is simple: Do not predict the market; wait for the market to signal its intent, then participate.
Tools and Logic:
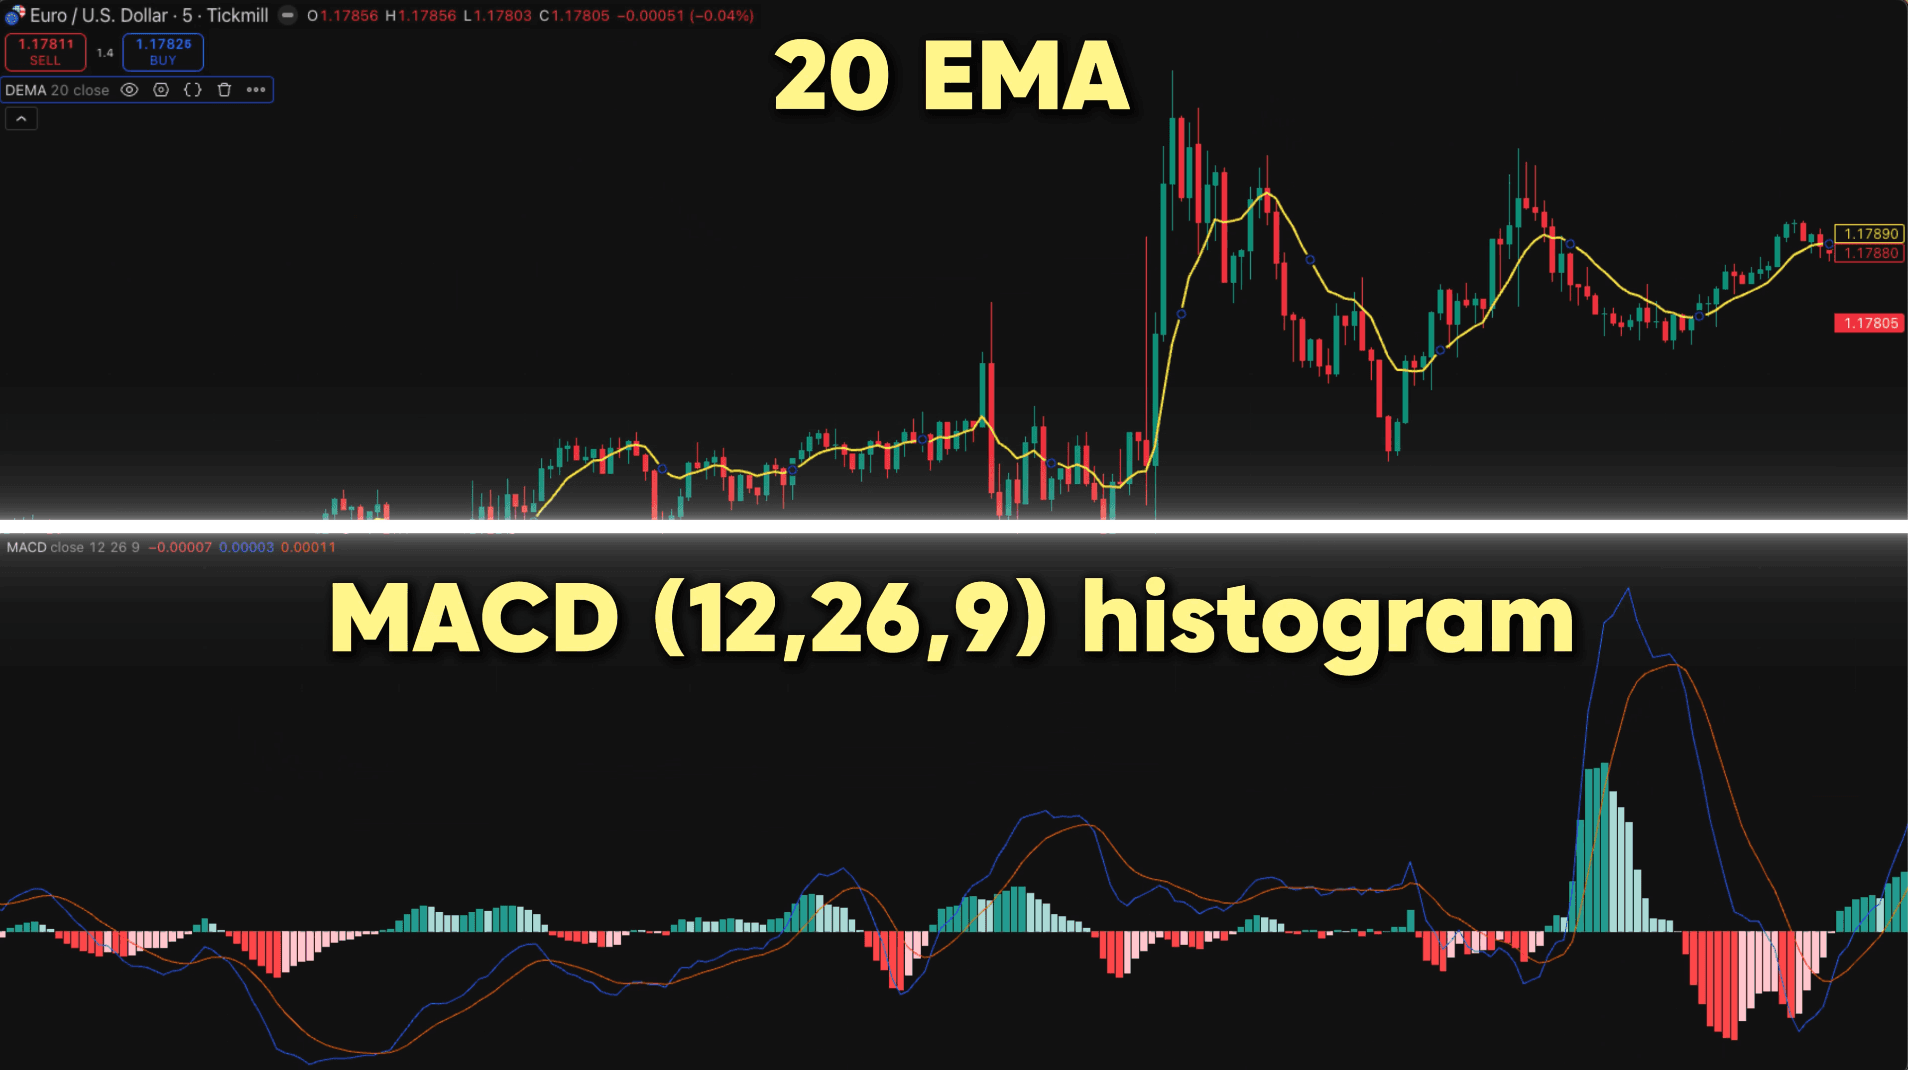
20-Period Exponential Moving Average (20 EMA):
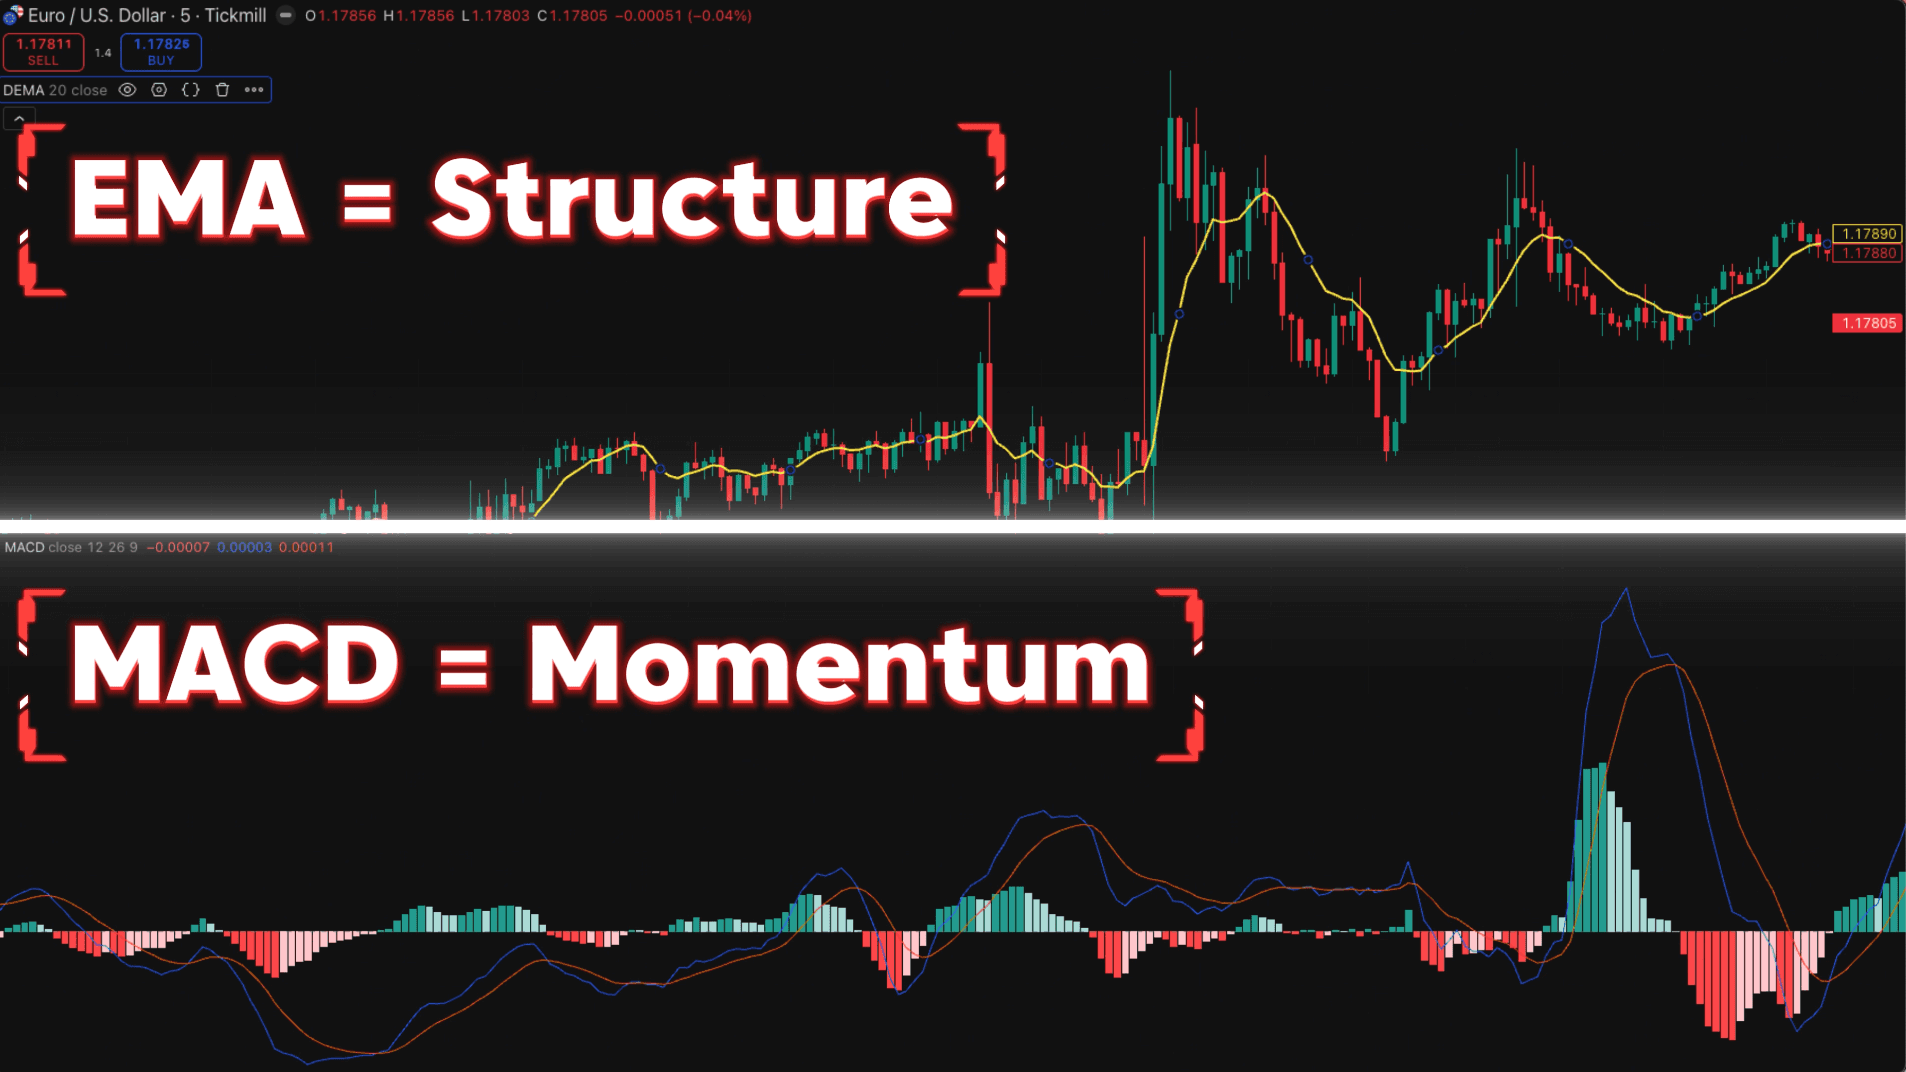
Function: Defines the short-term market structure. The EMA reacts quickly to recent price action, making it ideal for the fast-paced 5-minute timeframe. It helps traders identify the prevailing bullish or bearish structure.
Application: Price above the EMA suggests a bullish structure; price below the EMA suggests a bearish structure.
MACD (Settings: 12, 26, 9):
Function: Determines momentum. We focus specifically on the MACD Histogram to assess whether a potential reversal is backed by genuine volume and strength, rather than a fleeting spike.
Application: A Histogram flip from negative to positive (above the zero line) signals bullish momentum; a flip from positive to negative (below the zero line) signals bearish momentum.
Dual-Confirmation Principle (Structure + Momentum):
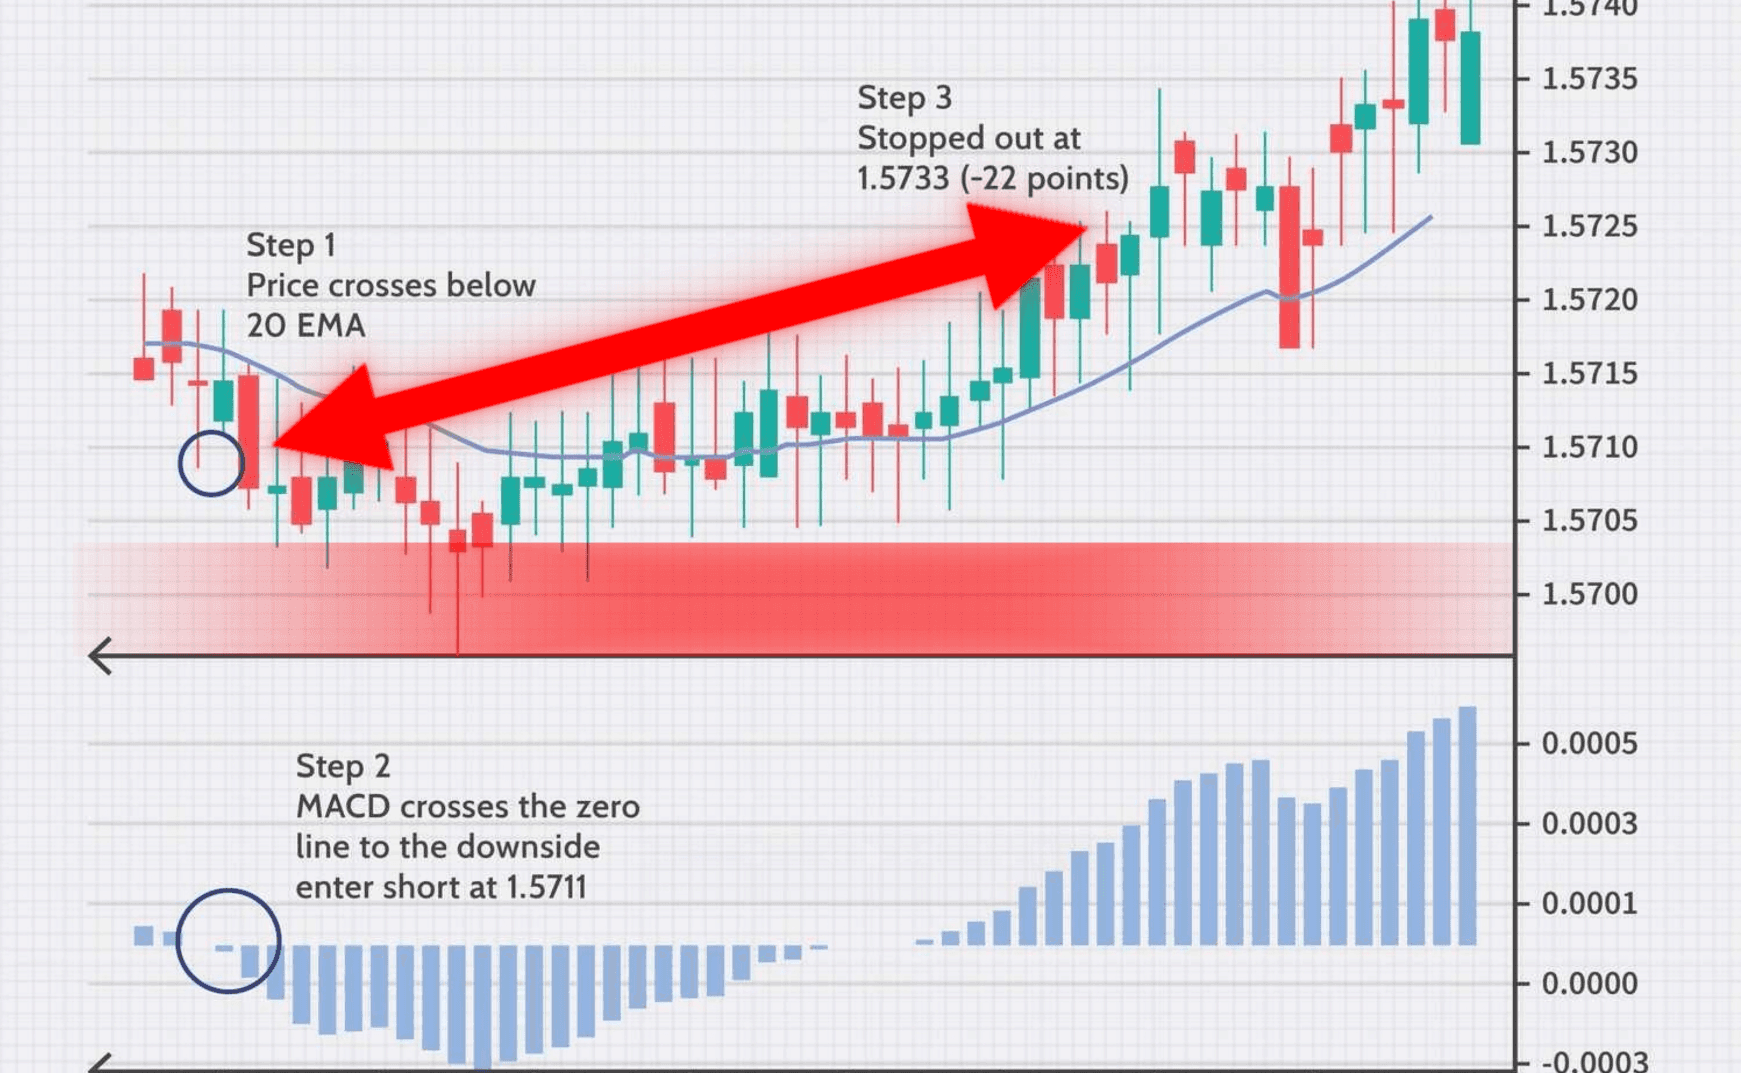
First Filter (Structure): A price break of the 20 EMA serves as an early warning signal that the market may be preparing for a move.
Second Filter (Momentum): A trade is only triggered when the MACD Histogram confirms the move by crossing the zero line.
Core Discipline: If the structure breaks but momentum does not confirm, stay out.
Case Study:
Consider a live example on the EUR/USD 5-minute chart:
Phase 1 (Wait Zone): Price breaks above the 20 EMA, forming a bullish structural setup. However, the MACD Histogram remains below the zero line, indicating that bearish momentum has not yet dissipated and bullish strength has not taken control. Entering a long position here would risk buying a false breakout at the peak.
Phase 2 (Confirmation Zone): Several minutes later, as buying pressure continues to build, the MACD Histogram flips from negative to positive, crossing above the zero line. At this moment, both conditions are met: structure (price above EMA) and momentum (MACD positive). This is the official trigger point to enter the trade.
Phase 3 (Position Management): After entry, price moves smoothly in the expected direction, reaching the initial profit target.
Position Sizing and Risk Management:
Tiered Profit Taking:
When the price reaches a 1:1 risk-reward ratio (floating profit equals initial stop-loss distance), close half of the position immediately to lock in risk-free profits.
Move the stop-loss on the remaining half to the entry price (break-even). From this point forward, the trade carries no risk of principal loss.
Dynamic Trailing Stop:
For the remaining half position, abandon fixed-profit targets. Instead, use the 20 EMA combined with a dynamic buffer (e.g., EMA ± 15 pips) as a trailing stop.
In a bullish trade, as long as price stays above the 20 EMA, hold the position. In a bearish trade, as long as price stays below the 20 EMA, hold the position. This allows the trade to capture extended trends until a clear reversal signal emerges.
Risk Mitigation:
No strategy is invincible. This system can struggle in low-volatility, choppy markets where breakouts lack follow-through. To mitigate this:
Avoid trading during low-volatility sessions or highly compressed consolidation phases.
Filter your signals by aligning them with the dominant trend of higher timeframes (e.g., 1H or 4H).
Trading at a professional level isn't about being right every time; it's about filtering out noise through rigorous structural and momentum verification, ensuring you are positioned correctly when the market finally moves.